
|
|
Package Summary
| Tags | No category tags. |
| Version | 0.3.0 |
| License | BSD |
| Build type | CATKIN |
| Use | RECOMMENDED |
Repository Summary
| Checkout URI | https://github.com/locusrobotics/robot_navigation.git |
| VCS Type | git |
| VCS Version | noetic |
| Last Updated | 2022-06-27 |
| Dev Status | DEVELOPED |
| CI status |
|
| Released | RELEASED |
| Tags | No category tags. |
| Contributing |
Help Wanted (0)
Good First Issues (0) Pull Requests to Review (0) |
Package Description
Additional Links
Maintainers
- David V. Lu!!
Authors
rqt_dwb_plugin
This package allows you to view dwb_msgs/LocalPlanEvaluation information visually using rqt. Currently only x/theta velocities are supported. The information can be viewed inside of rqt_bag or as an independent application. For a high level view of how rqt_bag plugins work,
check out this tutorial.
Eval View
You can show detailed information about a single LocalPlanEvaluation in one of two ways:
- Within
rqt_bagyou can right click theLocalPlanEvaluationdata much the same way you would view the raw values of the message. - You can also view live data with an independent application by running
rosrun rqt_dwb_plugin live_panel _ns:=/move_base/DWBLocalPlanner
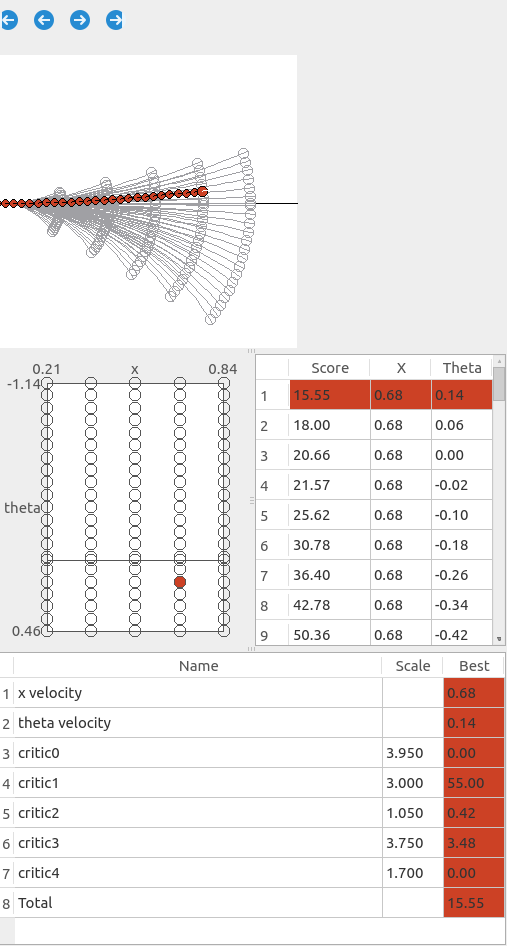
This view has four different components.
-
Trajectory Cloud - The top panel shows the Trajectory “Cloud”, with each of the poses for each of the trajectories drawn relative to the robot’s starting coordinates.
-
Velocity Space - The left panel shows each of the individual trajectories being evaluated in velocity space. The x axis represents the x component and the y axis represents the theta component. The highest and lowest values are displayed in the axis labels.
-
Sorted Scores - The right panel shows a table of the total score for each trajectory, as well as the x/theta velocity for that trajectory. They are sorted with increasing scores, thus the best option will always be first.
-
Detailed Scores - The bottom panel shows the detailed critic scores for the selected trajectories.
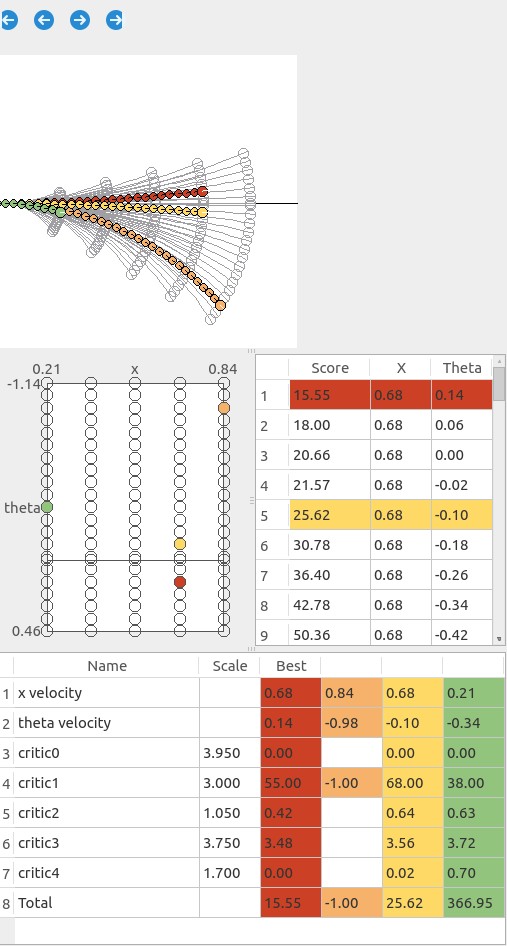
Selecting Additional Trajectories
The left and right panels give you the ability to select additional trajectories to be highlighted. Clicking in either the velocity space or sorted scores will add a trajectory from each panel in a new color. You can click again to remove it.
Additional Topics
Note that if /transformed_global_plan and /velocity also exist in the bag file with the same namespace, the plan will be drawn into the trajectory cloud, and the current velocity will be drawn into the velocity space.
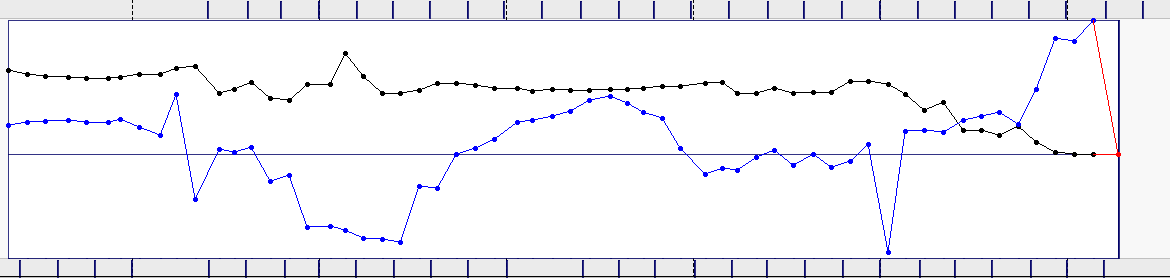
Timeline Plot
This feature only works within rqt_bag. If you turn on “Thumbnails”  for
for LocalPlanEvaluation data, it will show a plot of the best velocity values.

- The black line is the x component and blue is the theta component.
- If local planning failed, the values will be 0 and displayed in red, as seen at the end of the above bag.
Wiki Tutorials
Package Dependencies
System Dependencies
Dependant Packages
| Name | Deps |
|---|---|
| robot_nav_tools |
Launch files
Messages
Services
Plugins
Recent questions tagged rqt_dwb_plugin at Robotics Stack Exchange
|
|
Package Summary
| Tags | No category tags. |
| Version | 0.3.0 |
| License | BSD |
| Build type | CATKIN |
| Use | RECOMMENDED |
Repository Summary
| Checkout URI | https://github.com/locusrobotics/robot_navigation.git |
| VCS Type | git |
| VCS Version | melodic |
| Last Updated | 2021-07-30 |
| Dev Status | DEVELOPED |
| CI status |
|
| Released | RELEASED |
| Tags | No category tags. |
| Contributing |
Help Wanted (0)
Good First Issues (0) Pull Requests to Review (0) |
Package Description
Additional Links
Maintainers
- David V. Lu!!
Authors
rqt_dwb_plugin
This package allows you to view dwb_msgs/LocalPlanEvaluation information visually using rqt. Currently only x/theta velocities are supported. The information can be viewed inside of rqt_bag or as an independent application. For a high level view of how rqt_bag plugins work,
check out this tutorial.
Eval View
You can show detailed information about a single LocalPlanEvaluation in one of two ways:
- Within
rqt_bagyou can right click theLocalPlanEvaluationdata much the same way you would view the raw values of the message. - You can also view live data with an independent application by running
rosrun rqt_dwb_plugin live_panel _ns:=/move_base/DWBLocalPlanner

This view has four different components.
-
Trajectory Cloud - The top panel shows the Trajectory “Cloud”, with each of the poses for each of the trajectories drawn relative to the robot’s starting coordinates.
-
Velocity Space - The left panel shows each of the individual trajectories being evaluated in velocity space. The x axis represents the x component and the y axis represents the theta component. The highest and lowest values are displayed in the axis labels.
-
Sorted Scores - The right panel shows a table of the total score for each trajectory, as well as the x/theta velocity for that trajectory. They are sorted with increasing scores, thus the best option will always be first.
-
Detailed Scores - The bottom panel shows the detailed critic scores for the selected trajectories.
Selecting Additional Trajectories
The left and right panels give you the ability to select additional trajectories to be highlighted. Clicking in either the velocity space or sorted scores will add a trajectory from each panel in a new color. You can click again to remove it.

Additional Topics
Note that if /transformed_global_plan and /velocity also exist in the bag file with the same namespace, the plan will be drawn into the trajectory cloud, and the current velocity will be drawn into the velocity space.
Timeline Plot
This feature only works within rqt_bag. If you turn on “Thumbnails”  for
for LocalPlanEvaluation data, it will show a plot of the best velocity values.
- The black line is the x component and blue is the theta component.
- If local planning failed, the values will be 0 and displayed in red, as seen at the end of the above bag.
Wiki Tutorials
Package Dependencies
| Deps | Name |
|---|---|
| catkin | |
| dwb_msgs | |
| geometry_msgs | |
| python_qt_binding | |
| rospy | |
| rqt_bag | |
| roslint |
System Dependencies
Dependant Packages
| Name | Deps |
|---|---|
| robot_nav_tools |