
|
|
Repository Summary
| Checkout URI | https://github.com/ANYbotics/grid_map.git |
| VCS Type | git |
| VCS Version | humble |
| Last Updated | 2025-01-18 |
| Dev Status | DEVELOPED |
| Released | RELEASED |
| Tags | No category tags. |
| Contributing |
Help Wanted (-)
Good First Issues (-) Pull Requests to Review (-) |
Packages
| Name | Version |
|---|---|
| grid_map | 2.0.1 |
| grid_map_cmake_helpers | 2.0.1 |
| grid_map_core | 2.0.1 |
| grid_map_costmap_2d | 2.0.1 |
| grid_map_cv | 2.0.1 |
| grid_map_demos | 2.0.1 |
| grid_map_filters | 2.0.1 |
| grid_map_loader | 2.0.1 |
| grid_map_msgs | 2.0.1 |
| grid_map_octomap | 2.0.1 |
| grid_map_pcl | 2.0.1 |
| grid_map_ros | 2.0.1 |
| grid_map_rviz_plugin | 2.0.1 |
| grid_map_sdf | 2.0.1 |
| grid_map_visualization | 2.0.1 |
README
Grid Map
Overview
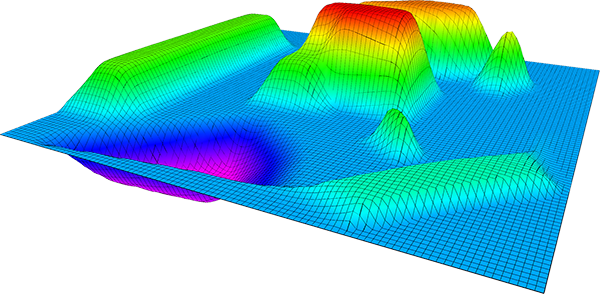
This is a C++ library with [ROS] interface to manage two-dimensional grid maps with multiple data layers. It is designed for mobile robotic mapping to store data such as elevation, variance, color, friction coefficient, foothold quality, surface normal, traversability etc. It is used in the Robot-Centric Elevation Mapping package designed for rough terrain navigation.
Features:
- Multi-layered: Developed for universal 2.5-dimensional grid mapping with support for any number of layers.
- Efficient map re-positioning: Data storage is implemented as two-dimensional circular buffer. This allows for non-destructive shifting of the map’s position (e.g. to follow the robot) without copying data in memory.
- Based on Eigen: Grid map data is stored as [Eigen] data types. Users can apply available Eigen algorithms directly to the map data for versatile and efficient data manipulation.
- Convenience functions: Several helper methods allow for convenient and memory safe cell data access. For example, iterator functions for rectangular, circular, polygonal regions and lines are implemented.
- ROS interface: Grid maps can be directly converted to and from ROS message types such as PointCloud2, OccupancyGrid, GridCells, and our custom GridMap message. Conversion packages provide compatibility with [costmap_2d], [PCL], and [OctoMap] data types.
- OpenCV interface: Grid maps can be seamlessly converted from and to [OpenCV] image types to make use of the tools provided by [OpenCV].
- Visualizations: The grid_map_rviz_plugin renders grid maps as 3d surface plots (height maps) in [RViz]. Additionally, the grid_map_visualization package helps to visualize grid maps as point clouds, occupancy grids, grid cells etc.
- Filters: The grid_map_filters provides are range of filters to process grid maps as a sequence of filters. Parsing of mathematical expressions allows to flexibly setup powerful computations such as thresholding, normal vectors, smoothening, variance, inpainting, and matrix kernel convolutions.
The grid map package has been tested with ROS2 Foxy (under Ubuntu 20.04). This is research code, expect that it changes often and any fitness for a particular purpose is disclaimed.
The source code is released under a BSD 3-Clause license.
Author: Péter Fankhauser
Affiliation: ANYbotics
Maintainer: Péter Fankhauser, pfankhauser@anybotics.com
With contributions by: Tanja Baumann, Jeff Delmerico, Remo Diethelm, Perry Franklin, Dominic Jud, Ralph Kaestner, Philipp Krüsi, Alex Millane, Daniel Stonier, Elena Stumm, Martin Wermelinger, Christos Zalidis, Edo Jelavic, Ruben Grandia, Simone Arreghini
This projected was initially developed at ETH Zurich (Autonomous Systems Lab & Robotic Systems Lab).
This work is conducted as part of ANYmal Research, a community to advance legged robotics.

Publications
If you use this work in an academic context, please cite the following publication:
P. Fankhauser and M. Hutter, “A Universal Grid Map Library: Implementation and Use Case for Rough Terrain Navigation”, in Robot Operating System (ROS) – The Complete Reference (Volume 1), A. Koubaa (Ed.), Springer, 2016. (PDF)
@incollection{Fankhauser2016GridMapLibrary,
  author = {Fankhauser, P{\'{e}}ter and Hutter, Marco},
  booktitle = {Robot Operating System (ROS) – The Complete Reference (Volume 1)},
  title = {{A Universal Grid Map Library: Implementation and Use Case for Rough Terrain Navigation}},
  chapter = {5},
  editor = {Koubaa, Anis},
  publisher = {Springer},
  year = {2016},
  isbn = {978-3-319-26052-5},
  doi = {10.1007/978-3-319-26054-9{\_}5},
  url = {http://www.springer.com/de/book/9783319260525}
}
Documentation
An introduction to the grid map library including a tutorial is given in this book chapter.
The C++ API is documented here:
- grid_map_core
- grid_map_ros
- grid_map_costmap_2d
- grid_map_cv
- grid_map_filters
- grid_map_octomap
- grid_map_pcl
Installation
Installation from Packages
To install all packages from the grid map library as Debian packages use
sudo apt-get install ros-$ROS_DISTRO-grid-map
Building from Source
Dependencies
Install ROS 2 Foxy from here.
The grid_map_core package depends only on the linear algebra library [Eigen].
sudo apt-get install libeigen3-dev
Source the ROS 2 underlay workspace.
source /opt/ros/foxy/setup.bash
Clone and build grid_map ROS2 dependencies.
mkdir -p ~/gridmap_dep/src
cd ~/gridmap_dep
wget https://raw.githubusercontent.com/ANYbotics/grid_map/humble/tools/ros2_dependencies.repos
vcs import src < ros2_dependencies.repos
rosdep install -y --ignore-src --from-paths src
colcon build --symlink-install --packages-up-to pcl_ros
The other packages depend additionally on the [ROS] standard installation (rclcpp, tf, filters, sensor_msgs, nav_msgs, and cv_bridge). Other format specific conversion packages (e.g. grid_map_cv, grid_map_pcl etc.) depend on packages described below in Packages Overview.
File truncated at 100 lines see the full file
CONTRIBUTING
|
|
Repository Summary
| Checkout URI | https://github.com/ANYbotics/grid_map.git |
| VCS Type | git |
| VCS Version | jazzy |
| Last Updated | 2025-01-18 |
| Dev Status | DEVELOPED |
| Released | RELEASED |
| Tags | No category tags. |
| Contributing |
Help Wanted (-)
Good First Issues (-) Pull Requests to Review (-) |
Packages
| Name | Version |
|---|---|
| grid_map | 2.2.1 |
| grid_map_cmake_helpers | 2.2.1 |
| grid_map_core | 2.2.1 |
| grid_map_costmap_2d | 2.2.1 |
| grid_map_cv | 2.2.1 |
| grid_map_demos | 2.2.1 |
| grid_map_filters | 2.2.1 |
| grid_map_loader | 2.2.1 |
| grid_map_msgs | 2.2.1 |
| grid_map_octomap | 2.2.1 |
| grid_map_pcl | 2.2.1 |
| grid_map_ros | 2.2.1 |
| grid_map_rviz_plugin | 2.2.1 |
| grid_map_sdf | 2.2.1 |
| grid_map_visualization | 2.2.1 |
README
Grid Map
Overview
This is a C++ library with [ROS] interface to manage two-dimensional grid maps with multiple data layers. It is designed for mobile robotic mapping to store data such as elevation, variance, color, friction coefficient, foothold quality, surface normal, traversability etc. It is used in the Robot-Centric Elevation Mapping package designed for rough terrain navigation.
Features:
- Multi-layered: Developed for universal 2.5-dimensional grid mapping with support for any number of layers.
- Efficient map re-positioning: Data storage is implemented as two-dimensional circular buffer. This allows for non-destructive shifting of the map’s position (e.g. to follow the robot) without copying data in memory.
- Based on Eigen: Grid map data is stored as [Eigen] data types. Users can apply available Eigen algorithms directly to the map data for versatile and efficient data manipulation.
- Convenience functions: Several helper methods allow for convenient and memory safe cell data access. For example, iterator functions for rectangular, circular, polygonal regions and lines are implemented.
- ROS interface: Grid maps can be directly converted to and from ROS message types such as PointCloud2, OccupancyGrid, GridCells, and our custom GridMap message. Conversion packages provide compatibility with [costmap_2d], [PCL], and [OctoMap] data types.
- OpenCV interface: Grid maps can be seamlessly converted from and to [OpenCV] image types to make use of the tools provided by [OpenCV].
- Visualizations: The grid_map_rviz_plugin renders grid maps as 3d surface plots (height maps) in [RViz]. Additionally, the grid_map_visualization package helps to visualize grid maps as point clouds, occupancy grids, grid cells etc.
- Filters: The grid_map_filters provides are range of filters to process grid maps as a sequence of filters. Parsing of mathematical expressions allows to flexibly setup powerful computations such as thresholding, normal vectors, smoothening, variance, inpainting, and matrix kernel convolutions.
The grid map package has been tested with ROS2 Foxy (under Ubuntu 20.04). This is research code, expect that it changes often and any fitness for a particular purpose is disclaimed.
The source code is released under a BSD 3-Clause license.
Author: Péter Fankhauser
Affiliation: ANYbotics
Maintainer: Péter Fankhauser, pfankhauser@anybotics.com
With contributions by: Tanja Baumann, Jeff Delmerico, Remo Diethelm, Perry Franklin, Dominic Jud, Ralph Kaestner, Philipp Krüsi, Alex Millane, Daniel Stonier, Elena Stumm, Martin Wermelinger, Christos Zalidis, Edo Jelavic, Ruben Grandia, Simone Arreghini
This projected was initially developed at ETH Zurich (Autonomous Systems Lab & Robotic Systems Lab).
This work is conducted as part of ANYmal Research, a community to advance legged robotics.

Publications
If you use this work in an academic context, please cite the following publication:
P. Fankhauser and M. Hutter, “A Universal Grid Map Library: Implementation and Use Case for Rough Terrain Navigation”, in Robot Operating System (ROS) – The Complete Reference (Volume 1), A. Koubaa (Ed.), Springer, 2016. (PDF)
@incollection{Fankhauser2016GridMapLibrary,
  author = {Fankhauser, P{\'{e}}ter and Hutter, Marco},
  booktitle = {Robot Operating System (ROS) – The Complete Reference (Volume 1)},
  title = {{A Universal Grid Map Library: Implementation and Use Case for Rough Terrain Navigation}},
  chapter = {5},
  editor = {Koubaa, Anis},
  publisher = {Springer},
  year = {2016},
  isbn = {978-3-319-26052-5},
  doi = {10.1007/978-3-319-26054-9{\_}5},
  url = {http://www.springer.com/de/book/9783319260525}
}
Documentation
An introduction to the grid map library including a tutorial is given in this book chapter.
The C++ API is documented here:
- grid_map_core
- grid_map_ros
- grid_map_costmap_2d
- grid_map_cv
- grid_map_filters
- grid_map_octomap
- grid_map_pcl
Installation
Installation from Packages
To install all packages from the grid map library as Debian packages use
sudo apt-get install ros-$ROS_DISTRO-grid-map
Building from Source
Dependencies
Install ROS 2 rolling from here.
Source the ROS 2 underlay workspace.
source /opt/ros/rolling/setup.bash
Clone and build grid_map ROS2 dependencies. The grid_map_core package depends only on the linear algebra library [Eigen] which is installed through rosdep.
mkdir -p ~/gridmap_dep/src
cd ~/gridmap_dep
wget https://raw.githubusercontent.com/ANYbotics/grid_map/rolling/tools/ros2_dependencies.repos
vcs import src < ros2_dependencies.repos
rosdep install -y --ignore-src --from-paths src
colcon build --symlink-install --packages-up-to pcl_ros
The other packages depend additionally on the [ROS] standard installation (rclcpp, tf, filters, sensor_msgs, nav_msgs, and cv_bridge). Other format specific conversion packages (e.g. grid_map_cv, grid_map_pcl etc.) depend on packages described below in Packages Overview.
Building grid_map
File truncated at 100 lines see the full file
CONTRIBUTING
|
|
Repository Summary
| Checkout URI | https://github.com/ANYbotics/grid_map.git |
| VCS Type | git |
| VCS Version | iron |
| Last Updated | 2025-01-18 |
| Dev Status | DEVELOPED |
| Released | RELEASED |
| Tags | No category tags. |
| Contributing |
Help Wanted (-)
Good First Issues (-) Pull Requests to Review (-) |
Packages
| Name | Version |
|---|---|
| grid_map | 2.1.1 |
| grid_map_cmake_helpers | 2.1.1 |
| grid_map_core | 2.1.1 |
| grid_map_costmap_2d | 2.1.1 |
| grid_map_cv | 2.1.1 |
| grid_map_demos | 2.1.1 |
| grid_map_filters | 2.1.1 |
| grid_map_loader | 2.1.1 |
| grid_map_msgs | 2.1.1 |
| grid_map_octomap | 2.1.1 |
| grid_map_pcl | 2.1.1 |
| grid_map_ros | 2.1.1 |
| grid_map_rviz_plugin | 2.1.1 |
| grid_map_sdf | 2.1.1 |
| grid_map_visualization | 2.1.1 |
README
Grid Map
Overview
This is a C++ library with [ROS] interface to manage two-dimensional grid maps with multiple data layers. It is designed for mobile robotic mapping to store data such as elevation, variance, color, friction coefficient, foothold quality, surface normal, traversability etc. It is used in the Robot-Centric Elevation Mapping package designed for rough terrain navigation.
Features:
- Multi-layered: Developed for universal 2.5-dimensional grid mapping with support for any number of layers.
- Efficient map re-positioning: Data storage is implemented as two-dimensional circular buffer. This allows for non-destructive shifting of the map’s position (e.g. to follow the robot) without copying data in memory.
- Based on Eigen: Grid map data is stored as [Eigen] data types. Users can apply available Eigen algorithms directly to the map data for versatile and efficient data manipulation.
- Convenience functions: Several helper methods allow for convenient and memory safe cell data access. For example, iterator functions for rectangular, circular, polygonal regions and lines are implemented.
- ROS interface: Grid maps can be directly converted to and from ROS message types such as PointCloud2, OccupancyGrid, GridCells, and our custom GridMap message. Conversion packages provide compatibility with [costmap_2d], [PCL], and [OctoMap] data types.
- OpenCV interface: Grid maps can be seamlessly converted from and to [OpenCV] image types to make use of the tools provided by [OpenCV].
- Visualizations: The grid_map_rviz_plugin renders grid maps as 3d surface plots (height maps) in [RViz]. Additionally, the grid_map_visualization package helps to visualize grid maps as point clouds, occupancy grids, grid cells etc.
- Filters: The grid_map_filters provides are range of filters to process grid maps as a sequence of filters. Parsing of mathematical expressions allows to flexibly setup powerful computations such as thresholding, normal vectors, smoothening, variance, inpainting, and matrix kernel convolutions.
The grid map package has been tested with ROS2 Foxy (under Ubuntu 20.04). This is research code, expect that it changes often and any fitness for a particular purpose is disclaimed.
The source code is released under a BSD 3-Clause license.
Author: Péter Fankhauser
Affiliation: ANYbotics
Maintainer: Péter Fankhauser, pfankhauser@anybotics.com
With contributions by: Tanja Baumann, Jeff Delmerico, Remo Diethelm, Perry Franklin, Dominic Jud, Ralph Kaestner, Philipp Krüsi, Alex Millane, Daniel Stonier, Elena Stumm, Martin Wermelinger, Christos Zalidis, Edo Jelavic, Ruben Grandia, Simone Arreghini
This projected was initially developed at ETH Zurich (Autonomous Systems Lab & Robotic Systems Lab).
This work is conducted as part of ANYmal Research, a community to advance legged robotics.
Publications
If you use this work in an academic context, please cite the following publication:
P. Fankhauser and M. Hutter, “A Universal Grid Map Library: Implementation and Use Case for Rough Terrain Navigation”, in Robot Operating System (ROS) – The Complete Reference (Volume 1), A. Koubaa (Ed.), Springer, 2016. (PDF)
@incollection{Fankhauser2016GridMapLibrary,
  author = {Fankhauser, P{\'{e}}ter and Hutter, Marco},
  booktitle = {Robot Operating System (ROS) – The Complete Reference (Volume 1)},
  title = {{A Universal Grid Map Library: Implementation and Use Case for Rough Terrain Navigation}},
  chapter = {5},
  editor = {Koubaa, Anis},
  publisher = {Springer},
  year = {2016},
  isbn = {978-3-319-26052-5},
  doi = {10.1007/978-3-319-26054-9{\_}5},
  url = {http://www.springer.com/de/book/9783319260525}
}
Documentation
An introduction to the grid map library including a tutorial is given in this book chapter.
The C++ API is documented here:
- grid_map_core
- grid_map_ros
- grid_map_costmap_2d
- grid_map_cv
- grid_map_filters
- grid_map_octomap
- grid_map_pcl
Installation
Installation from Packages
To install all packages from the grid map library as Debian packages use
sudo apt-get install ros-$ROS_DISTRO-grid-map
Building from Source
Dependencies
Install ROS 2 Iron from here.
The grid_map_core package depends only on the linear algebra library [Eigen].
sudo apt-get install libeigen3-dev
Source the ROS 2 underlay workspace.
source /opt/ros/iron/setup.bash
Clone and build grid_map ROS2 dependencies.
mkdir -p ~/gridmap_dep/src
cd ~/gridmap_dep
wget https://raw.githubusercontent.com/ANYbotics/grid_map/ros2/tools/ros2_dependencies.repos
vcs import src < ros2_dependencies.repos
rosdep install -y --ignore-src --from-paths src
colcon build --symlink-install --packages-up-to pcl_ros
The other packages depend additionally on the [ROS] standard installation (rclcpp, tf, filters, sensor_msgs, nav_msgs, and cv_bridge). Other format specific conversion packages (e.g. grid_map_cv, grid_map_pcl etc.) depend on packages described below in Packages Overview.
File truncated at 100 lines see the full file