Repository Summary
| Checkout URI | https://github.com/open-rmf/rmf_visualization.git |
| VCS Type | git |
| VCS Version | humble |
| Last Updated | 2024-05-24 |
| Dev Status | DEVELOPED |
| Released | RELEASED |
| Contributing |
Help Wanted (-)
Good First Issues (-) Pull Requests to Review (-) |
Packages
| Name | Version |
|---|---|
| rmf_visualization | 2.0.2 |
| rmf_visualization_building_systems | 2.0.2 |
| rmf_visualization_fleet_states | 2.0.2 |
| rmf_visualization_floorplans | 2.0.2 |
| rmf_visualization_navgraphs | 2.0.2 |
| rmf_visualization_obstacles | 2.0.2 |
| rmf_visualization_rviz2_plugins | 2.0.2 |
| rmf_visualization_schedule | 2.0.2 |
README
Open-RMF Visualization
![]()
![]()
![]()

This repository contains several packages that aid with visualizing various entities within RMF via RViz.
- rmf_visualization
- rmf_visualization_building_systems
- rmf_visualization_fleet_states
- rmf_visualization_floorplans
- rmf_visualization_navgraphs
- rmf_visualization_obstacles
- rmf_visualization_rviz2_plugins
- rmf_visualization_schedule
Installation
It is recommended to follow the instructions here to setup an RMF workspace with the packages in this repository along with other dependencies.
rmf_visualization
A package that contains the main launch file to bringup all the visualizers. Descriptions of various configurable parameters is provided within the launch file.
To launch the visualizer
ros2 launch rmf_visualization visualization.launch.xml
rmf_visualization_building_systems
A visualizer for lifts and doors in the facility. The ROS 2 node subscribes to DoorState and LiftState ROS 2 messages published over /door_states and /lift_states topics. It then publishes RViz markers depicting the location and status of these systems over /building_systems_markers with Transient Local durability.
rmf_visualization_fleet_states
A visualizer for the current positions of various robot as reported by their fleet managers. The ROS 2 node subscribes to FleetState ROS 2 messages published over /fleet_states. It then publishes RViz markers depicting the location of the robots over /fleet_markers.
rmf_visualization_floorplans
A visualizer for the floorplan images for each building level. The ROS 2 node subscribes to BuildingMap ROS 2 messages published over /map. It then converts the image to an OccupancyGrid and publishes it over /floorplan.
rmf_visualization_navgraphs
https://user-images.githubusercontent.com/13482049/176585472-115ef57b-7792-4f02-93d3-c50a3ad70c95.mp4
A visualizer for the navigation graphs used by each fleet of robots. Lanes that are closed are shared grey while speed limited ones have relatively narrower widths. The ROS 2 node subscribes to Graph ROS 2 messages published over /nav_graphs. It then publishes RViz markers depicting color coded lanes for each fleet over /map_markers with Transient Local durability.
rmf_visualization_obstacles

A visualizer for obstacles detected. The ROS 2 node subscribes to Obstacles ROS 2 messages published over /rmf_obstacles. It then publishes RViz markers depicting the obstacles over /fleet_markers with Transient Local durability.
rmf_visualization_rviz2_plugins
 This package provides several RViz panels to update the view and submit requests to Open-RMF.
RMFSchedulePanel
For a given map_name, the rmf_visualization_schedule_data_node queries for trajectories in the RMF schedule database over a duration that is specified by start_duration and query_duration parameters.
The expected location and vicinity of a participant are visualized with concentric yellow and blue circles respectively.
The expected trajectory for a participant is a green polyline when conflict-free and is red otherwise.
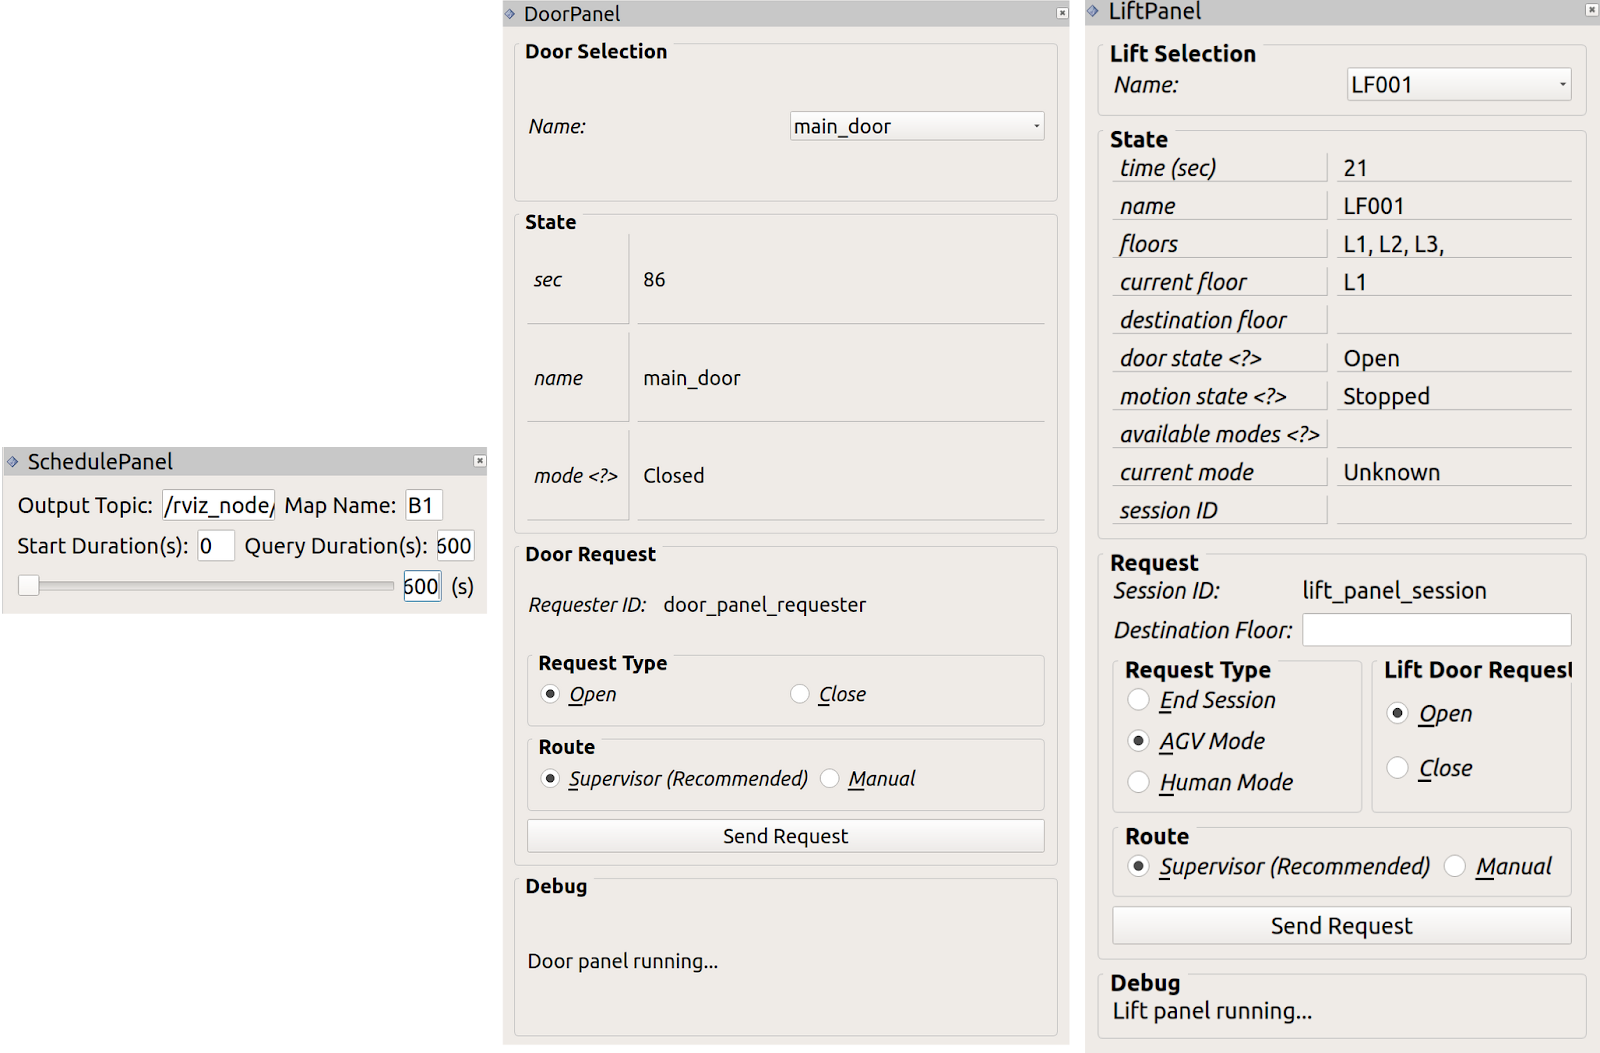
The SchedulePanel in RViz allows users to modify the parameters used to query trajectories in the schedule database.
Door and Lift panels
Door and Lift panels allow users to interact with these systems respectively.
The rmf.rviz file is used to save the configuration of RViz along with default values of parameters used in the different panels.
rmf_visualization_schedule

A visualizer of the predicted schedule of robots as submitted by fleet adapters to the RMF Schedule Database. The ROS 2 node spawns a Mirror of the RMF Schedule Database which is queries before publishing markers depicting the trajectory of robots as green line strips to /schedule_markers. The footprint and vicinity of each robot is represented by yellow and cyan cylindrical markers respectively.
An active rmf_traffic_schedule node is prerequisite for the visualizer to initialize. If a schedule node is not running, it can be started with the command
ros2 run rmf_traffic_ros2 rmf_traffic_schedule
Note: Only one instance of
rmf_traffic_schedulemust be active at any moment.
Websocket Server for Custom UIs
For developers looking to create custom UIs outside of the ROS2 environment, this repository provides a websocket server to exchange information contained in an active rmf schedule database. This may primarily be used to query for robot trajectories in the schedule along with conflict information if any. The format for various requests and corresponding responses are described below.
The websocket server starts up when visualization.launch.xml is launched.
Sample Client Requests
Server Time
To receive the current server time in milliseconds
{"request":"time","param":{}}
Sample server response
{"response":"time","values":[167165000000]}
Trajectories in RMF Schedule
To receive a list of active trajectories and conflicts if any between now and until a duration(milliseconds)
{"request":"trajectory","param":{"map_name":"L1","duration":60000, "trim":true}}
If trim is false, data of the complete trajectory is forwarded even if there is only partial overlap in the query duration.
File truncated at 100 lines see the full file
CONTRIBUTING
Repository Summary
| Checkout URI | https://github.com/open-rmf/rmf_visualization.git |
| VCS Type | git |
| VCS Version | jazzy |
| Last Updated | 2024-06-14 |
| Dev Status | DEVELOPED |
| Released | RELEASED |
| Contributing |
Help Wanted (-)
Good First Issues (-) Pull Requests to Review (-) |
Packages
| Name | Version |
|---|---|
| rmf_visualization | 2.3.2 |
| rmf_visualization_building_systems | 2.3.2 |
| rmf_visualization_fleet_states | 2.3.2 |
| rmf_visualization_floorplans | 2.3.2 |
| rmf_visualization_navgraphs | 2.3.2 |
| rmf_visualization_obstacles | 2.3.2 |
| rmf_visualization_rviz2_plugins | 2.3.2 |
| rmf_visualization_schedule | 2.3.2 |
README
Open-RMF Visualization
![]()
![]()
![]()
This repository contains several packages that aid with visualizing various entities within RMF via RViz.
- rmf_visualization
- rmf_visualization_building_systems
- rmf_visualization_fleet_states
- rmf_visualization_floorplans
- rmf_visualization_navgraphs
- rmf_visualization_obstacles
- rmf_visualization_rviz2_plugins
- rmf_visualization_schedule
Installation
It is recommended to follow the instructions here to setup an RMF workspace with the packages in this repository along with other dependencies.
rmf_visualization
A package that contains the main launch file to bringup all the visualizers. Descriptions of various configurable parameters is provided within the launch file.
To launch the visualizer
ros2 launch rmf_visualization visualization.launch.xml
rmf_visualization_building_systems
A visualizer for lifts and doors in the facility. The ROS 2 node subscribes to DoorState and LiftState ROS 2 messages published over /door_states and /lift_states topics. It then publishes RViz markers depicting the location and status of these systems over /building_systems_markers with Transient Local durability.
rmf_visualization_fleet_states
A visualizer for the current positions of various robot as reported by their fleet managers. The ROS 2 node subscribes to FleetState ROS 2 messages published over /fleet_states. It then publishes RViz markers depicting the location of the robots over /fleet_markers.
rmf_visualization_floorplans
A visualizer for the floorplan images for each building level. The ROS 2 node subscribes to BuildingMap ROS 2 messages published over /map. It then converts the image to an OccupancyGrid and publishes it over /floorplan.
rmf_visualization_navgraphs
https://user-images.githubusercontent.com/13482049/176585472-115ef57b-7792-4f02-93d3-c50a3ad70c95.mp4
A visualizer for the navigation graphs used by each fleet of robots. Lanes that are closed are shared grey while speed limited ones have relatively narrower widths. The ROS 2 node subscribes to Graph ROS 2 messages published over /nav_graphs. It then publishes RViz markers depicting color coded lanes for each fleet over /map_markers with Transient Local durability.
rmf_visualization_obstacles
A visualizer for obstacles detected. The ROS 2 node subscribes to Obstacles ROS 2 messages published over /rmf_obstacles. It then publishes RViz markers depicting the obstacles over /fleet_markers with Transient Local durability.
rmf_visualization_rviz2_plugins
 This package provides several RViz panels to update the view and submit requests to Open-RMF.
RMFSchedulePanel
For a given map_name, the rmf_visualization_schedule_data_node queries for trajectories in the RMF schedule database over a duration that is specified by start_duration and query_duration parameters.
The expected location and vicinity of a participant are visualized with concentric yellow and blue circles respectively.
The expected trajectory for a participant is a green polyline when conflict-free and is red otherwise.
The SchedulePanel in RViz allows users to modify the parameters used to query trajectories in the schedule database.
Door and Lift panels
Door and Lift panels allow users to interact with these systems respectively.
The rmf.rviz file is used to save the configuration of RViz along with default values of parameters used in the different panels.
rmf_visualization_schedule

A visualizer of the predicted schedule of robots as submitted by fleet adapters to the RMF Schedule Database. The ROS 2 node spawns a Mirror of the RMF Schedule Database which is queries before publishing markers depicting the trajectory of robots as green line strips to /schedule_markers. The footprint and vicinity of each robot is represented by yellow and cyan cylindrical markers respectively.
An active rmf_traffic_schedule node is prerequisite for the visualizer to initialize. If a schedule node is not running, it can be started with the command
ros2 run rmf_traffic_ros2 rmf_traffic_schedule
Note: Only one instance of
rmf_traffic_schedulemust be active at any moment.
Websocket Server for Custom UIs
For developers looking to create custom UIs outside of the ROS2 environment, this repository provides a websocket server to exchange information contained in an active rmf schedule database. This may primarily be used to query for robot trajectories in the schedule along with conflict information if any. The format for various requests and corresponding responses are described below.
The websocket server starts up when visualization.launch.xml is launched.
Sample Client Requests
Server Time
To receive the current server time in milliseconds
{"request":"time","param":{}}
Sample server response
{"response":"time","values":[167165000000]}
Trajectories in RMF Schedule
To receive a list of active trajectories and conflicts if any between now and until a duration(milliseconds)
{"request":"trajectory","param":{"map_name":"L1","duration":60000, "trim":true}}
If trim is false, data of the complete trajectory is forwarded even if there is only partial overlap in the query duration.
File truncated at 100 lines see the full file
CONTRIBUTING
Repository Summary
| Checkout URI | https://github.com/open-rmf/rmf_visualization.git |
| VCS Type | git |
| VCS Version | kilted |
| Last Updated | 2025-05-14 |
| Dev Status | DEVELOPED |
| Released | RELEASED |
| Contributing |
Help Wanted (-)
Good First Issues (-) Pull Requests to Review (-) |
Packages
| Name | Version |
|---|---|
| rmf_visualization | 2.4.2 |
| rmf_visualization_building_systems | 2.4.2 |
| rmf_visualization_fleet_states | 2.4.2 |
| rmf_visualization_floorplans | 2.4.2 |
| rmf_visualization_navgraphs | 2.4.2 |
| rmf_visualization_obstacles | 2.4.2 |
| rmf_visualization_rviz2_plugins | 2.4.2 |
| rmf_visualization_schedule | 2.4.2 |
README
Open-RMF Visualization
![]()
![]()
![]()
This repository contains several packages that aid with visualizing various entities within RMF via RViz.
- rmf_visualization
- rmf_visualization_building_systems
- rmf_visualization_fleet_states
- rmf_visualization_floorplans
- rmf_visualization_navgraphs
- rmf_visualization_obstacles
- rmf_visualization_rviz2_plugins
- rmf_visualization_schedule
Installation
It is recommended to follow the instructions here to setup an RMF workspace with the packages in this repository along with other dependencies.
rmf_visualization
A package that contains the main launch file to bringup all the visualizers. Descriptions of various configurable parameters is provided within the launch file.
To launch the visualizer
ros2 launch rmf_visualization visualization.launch.xml
rmf_visualization_building_systems
A visualizer for lifts and doors in the facility. The ROS 2 node subscribes to DoorState and LiftState ROS 2 messages published over /door_states and /lift_states topics. It then publishes RViz markers depicting the location and status of these systems over /building_systems_markers with Transient Local durability.
rmf_visualization_fleet_states
A visualizer for the current positions of various robot as reported by their fleet managers. The ROS 2 node subscribes to FleetState ROS 2 messages published over /fleet_states. It then publishes RViz markers depicting the location of the robots over /fleet_markers.
rmf_visualization_floorplans
A visualizer for the floorplan images for each building level. The ROS 2 node subscribes to BuildingMap ROS 2 messages published over /map. It then converts the image to an OccupancyGrid and publishes it over /floorplan.
rmf_visualization_navgraphs
https://user-images.githubusercontent.com/13482049/176585472-115ef57b-7792-4f02-93d3-c50a3ad70c95.mp4
A visualizer for the navigation graphs used by each fleet of robots. Lanes that are closed are shared grey while speed limited ones have relatively narrower widths. The ROS 2 node subscribes to Graph ROS 2 messages published over /nav_graphs. It then publishes RViz markers depicting color coded lanes for each fleet over /map_markers with Transient Local durability.
rmf_visualization_obstacles
A visualizer for obstacles detected. The ROS 2 node subscribes to Obstacles ROS 2 messages published over /rmf_obstacles. It then publishes RViz markers depicting the obstacles over /fleet_markers with Transient Local durability.
rmf_visualization_rviz2_plugins
 This package provides several RViz panels to update the view and submit requests to Open-RMF.
RMFSchedulePanel
For a given map_name, the rmf_visualization_schedule_data_node queries for trajectories in the RMF schedule database over a duration that is specified by start_duration and query_duration parameters.
The expected location and vicinity of a participant are visualized with concentric yellow and blue circles respectively.
The expected trajectory for a participant is a green polyline when conflict-free and is red otherwise.
The SchedulePanel in RViz allows users to modify the parameters used to query trajectories in the schedule database.
Door and Lift panels
Door and Lift panels allow users to interact with these systems respectively.
The rmf.rviz file is used to save the configuration of RViz along with default values of parameters used in the different panels.
rmf_visualization_schedule

A visualizer of the predicted schedule of robots as submitted by fleet adapters to the RMF Schedule Database. The ROS 2 node spawns a Mirror of the RMF Schedule Database which is queries before publishing markers depicting the trajectory of robots as green line strips to /schedule_markers. The footprint and vicinity of each robot is represented by yellow and cyan cylindrical markers respectively.
An active rmf_traffic_schedule node is prerequisite for the visualizer to initialize. If a schedule node is not running, it can be started with the command
ros2 run rmf_traffic_ros2 rmf_traffic_schedule
Note: Only one instance of
rmf_traffic_schedulemust be active at any moment.
Websocket Server for Custom UIs
For developers looking to create custom UIs outside of the ROS2 environment, this repository provides a websocket server to exchange information contained in an active rmf schedule database. This may primarily be used to query for robot trajectories in the schedule along with conflict information if any. The format for various requests and corresponding responses are described below.
The websocket server starts up when visualization.launch.xml is launched.
Sample Client Requests
Server Time
To receive the current server time in milliseconds
{"request":"time","param":{}}
Sample server response
{"response":"time","values":[167165000000]}
Trajectories in RMF Schedule
To receive a list of active trajectories and conflicts if any between now and until a duration(milliseconds)
{"request":"trajectory","param":{"map_name":"L1","duration":60000, "trim":true}}
If trim is false, data of the complete trajectory is forwarded even if there is only partial overlap in the query duration.
File truncated at 100 lines see the full file
CONTRIBUTING
Repository Summary
| Checkout URI | https://github.com/open-rmf/rmf_visualization.git |
| VCS Type | git |
| VCS Version | main |
| Last Updated | 2026-06-17 |
| Dev Status | DEVELOPED |
| Released | RELEASED |
| Contributing |
Help Wanted (-)
Good First Issues (-) Pull Requests to Review (-) |
Packages
| Name | Version |
|---|---|
| rmf_visualization | 2.6.0 |
| rmf_visualization_building_systems | 2.6.0 |
| rmf_visualization_fleet_states | 2.6.0 |
| rmf_visualization_floorplans | 2.6.0 |
| rmf_visualization_navgraphs | 2.6.0 |
| rmf_visualization_obstacles | 2.6.0 |
| rmf_visualization_rviz2_plugins | 2.6.0 |
| rmf_visualization_schedule | 2.6.0 |
README
Open-RMF Visualization
![]()
![]()
![]()
This repository contains several packages that aid with visualizing various entities within RMF via RViz.
- rmf_visualization
- rmf_visualization_building_systems
- rmf_visualization_fleet_states
- rmf_visualization_floorplans
- rmf_visualization_navgraphs
- rmf_visualization_obstacles
- rmf_visualization_rviz2_plugins
- rmf_visualization_schedule
Installation
It is recommended to follow the instructions here to setup an RMF workspace with the packages in this repository along with other dependencies.
rmf_visualization
A package that contains the main launch file to bringup all the visualizers. Descriptions of various configurable parameters is provided within the launch file.
To launch the visualizer
ros2 launch rmf_visualization visualization.launch.xml
rmf_visualization_building_systems
A visualizer for lifts and doors in the facility. The ROS 2 node subscribes to DoorState and LiftState ROS 2 messages published over /door_states and /lift_states topics. It then publishes RViz markers depicting the location and status of these systems over /building_systems_markers with Transient Local durability.
rmf_visualization_fleet_states
A visualizer for the current positions of various robot as reported by their fleet managers. The ROS 2 node subscribes to FleetState ROS 2 messages published over /fleet_states. It then publishes RViz markers depicting the location of the robots over /fleet_markers.
rmf_visualization_floorplans
A visualizer for the floorplan images for each building level. The ROS 2 node subscribes to BuildingMap ROS 2 messages published over /map. It then converts the image to an OccupancyGrid and publishes it over /floorplan.
rmf_visualization_navgraphs
https://user-images.githubusercontent.com/13482049/176585472-115ef57b-7792-4f02-93d3-c50a3ad70c95.mp4
A visualizer for the navigation graphs used by each fleet of robots. Lanes that are closed are shared grey while speed limited ones have relatively narrower widths. The ROS 2 node subscribes to Graph ROS 2 messages published over /nav_graphs. It then publishes RViz markers depicting color coded lanes for each fleet over /map_markers with Transient Local durability.
rmf_visualization_obstacles
A visualizer for obstacles detected. The ROS 2 node subscribes to Obstacles ROS 2 messages published over /rmf_obstacles. It then publishes RViz markers depicting the obstacles over /fleet_markers with Transient Local durability.
rmf_visualization_rviz2_plugins
This package provides several RViz panels to update the view and submit requests to Open-RMF.
RMFSchedulePanel
For a given map_name, the rmf_visualization_schedule_data_node queries for trajectories in the RMF schedule database over a duration that is specified by start_duration and query_duration parameters.
The expected location and vicinity of a participant are visualized with concentric yellow and blue circles respectively.
The expected trajectory for a participant is a green polyline when conflict-free and is red otherwise.
The SchedulePanel in RViz allows users to modify the parameters used to query trajectories in the schedule database.
Door and Lift panels
Door and Lift panels allow users to interact with these systems respectively.
The rmf.rviz file is used to save the configuration of RViz along with default values of parameters used in the different panels.
rmf_visualization_schedule
A visualizer of the predicted schedule of robots as submitted by fleet adapters to the RMF Schedule Database. The ROS 2 node spawns a Mirror of the RMF Schedule Database which is queries before publishing markers depicting the trajectory of robots as green line strips to /schedule_markers. The footprint and vicinity of each robot is represented by yellow and cyan cylindrical markers respectively.
An active rmf_traffic_schedule node is prerequisite for the visualizer to initialize. If a schedule node is not running, it can be started with the command
ros2 run rmf_traffic_ros2 rmf_traffic_schedule
Note: Only one instance of
rmf_traffic_schedulemust be active at any moment.
Websocket Server for Custom UIs
For developers looking to create custom UIs outside of the ROS2 environment, this repository provides a websocket server to exchange information contained in an active rmf schedule database. This may primarily be used to query for robot trajectories in the schedule along with conflict information if any. The format for various requests and corresponding responses are described below.
The websocket server starts up when visualization.launch.xml is launched.
Sample Client Requests
Server Time
To receive the current server time in milliseconds
{"request":"time","param":{}}
Sample server response
{"response":"time","values":[167165000000]}
Trajectories in RMF Schedule
To receive a list of active trajectories and conflicts if any between now and until a duration(milliseconds)
{"request":"trajectory","param":{"map_name":"L1","duration":60000, "trim":true}}
If trim is false, data of the complete trajectory is forwarded even if there is only partial overlap in the query duration.
File truncated at 100 lines see the full file
CONTRIBUTING
Repository Summary
| Checkout URI | https://github.com/open-rmf/rmf_visualization.git |
| VCS Type | git |
| VCS Version | humble |
| Last Updated | 2024-05-24 |
| Dev Status | DEVELOPED |
| Released | RELEASED |
| Contributing |
Help Wanted (-)
Good First Issues (-) Pull Requests to Review (-) |
Packages
| Name | Version |
|---|---|
| rmf_visualization | 2.0.2 |
| rmf_visualization_building_systems | 2.0.2 |
| rmf_visualization_fleet_states | 2.0.2 |
| rmf_visualization_floorplans | 2.0.2 |
| rmf_visualization_navgraphs | 2.0.2 |
| rmf_visualization_obstacles | 2.0.2 |
| rmf_visualization_rviz2_plugins | 2.0.2 |
| rmf_visualization_schedule | 2.0.2 |
README
Open-RMF Visualization
![]()
![]()
![]()
This repository contains several packages that aid with visualizing various entities within RMF via RViz.
- rmf_visualization
- rmf_visualization_building_systems
- rmf_visualization_fleet_states
- rmf_visualization_floorplans
- rmf_visualization_navgraphs
- rmf_visualization_obstacles
- rmf_visualization_rviz2_plugins
- rmf_visualization_schedule
Installation
It is recommended to follow the instructions here to setup an RMF workspace with the packages in this repository along with other dependencies.
rmf_visualization
A package that contains the main launch file to bringup all the visualizers. Descriptions of various configurable parameters is provided within the launch file.
To launch the visualizer
ros2 launch rmf_visualization visualization.launch.xml
rmf_visualization_building_systems
A visualizer for lifts and doors in the facility. The ROS 2 node subscribes to DoorState and LiftState ROS 2 messages published over /door_states and /lift_states topics. It then publishes RViz markers depicting the location and status of these systems over /building_systems_markers with Transient Local durability.
rmf_visualization_fleet_states
A visualizer for the current positions of various robot as reported by their fleet managers. The ROS 2 node subscribes to FleetState ROS 2 messages published over /fleet_states. It then publishes RViz markers depicting the location of the robots over /fleet_markers.
rmf_visualization_floorplans
A visualizer for the floorplan images for each building level. The ROS 2 node subscribes to BuildingMap ROS 2 messages published over /map. It then converts the image to an OccupancyGrid and publishes it over /floorplan.
rmf_visualization_navgraphs
https://user-images.githubusercontent.com/13482049/176585472-115ef57b-7792-4f02-93d3-c50a3ad70c95.mp4
A visualizer for the navigation graphs used by each fleet of robots. Lanes that are closed are shared grey while speed limited ones have relatively narrower widths. The ROS 2 node subscribes to Graph ROS 2 messages published over /nav_graphs. It then publishes RViz markers depicting color coded lanes for each fleet over /map_markers with Transient Local durability.
rmf_visualization_obstacles
A visualizer for obstacles detected. The ROS 2 node subscribes to Obstacles ROS 2 messages published over /rmf_obstacles. It then publishes RViz markers depicting the obstacles over /fleet_markers with Transient Local durability.
rmf_visualization_rviz2_plugins
This package provides several RViz panels to update the view and submit requests to Open-RMF.
RMFSchedulePanel
For a given map_name, the rmf_visualization_schedule_data_node queries for trajectories in the RMF schedule database over a duration that is specified by start_duration and query_duration parameters.
The expected location and vicinity of a participant are visualized with concentric yellow and blue circles respectively.
The expected trajectory for a participant is a green polyline when conflict-free and is red otherwise.
The SchedulePanel in RViz allows users to modify the parameters used to query trajectories in the schedule database.
Door and Lift panels
Door and Lift panels allow users to interact with these systems respectively.
The rmf.rviz file is used to save the configuration of RViz along with default values of parameters used in the different panels.
rmf_visualization_schedule
A visualizer of the predicted schedule of robots as submitted by fleet adapters to the RMF Schedule Database. The ROS 2 node spawns a Mirror of the RMF Schedule Database which is queries before publishing markers depicting the trajectory of robots as green line strips to /schedule_markers. The footprint and vicinity of each robot is represented by yellow and cyan cylindrical markers respectively.
An active rmf_traffic_schedule node is prerequisite for the visualizer to initialize. If a schedule node is not running, it can be started with the command
ros2 run rmf_traffic_ros2 rmf_traffic_schedule
Note: Only one instance of
rmf_traffic_schedulemust be active at any moment.
Websocket Server for Custom UIs
For developers looking to create custom UIs outside of the ROS2 environment, this repository provides a websocket server to exchange information contained in an active rmf schedule database. This may primarily be used to query for robot trajectories in the schedule along with conflict information if any. The format for various requests and corresponding responses are described below.
The websocket server starts up when visualization.launch.xml is launched.
Sample Client Requests
Server Time
To receive the current server time in milliseconds
{"request":"time","param":{}}
Sample server response
{"response":"time","values":[167165000000]}
Trajectories in RMF Schedule
To receive a list of active trajectories and conflicts if any between now and until a duration(milliseconds)
{"request":"trajectory","param":{"map_name":"L1","duration":60000, "trim":true}}
If trim is false, data of the complete trajectory is forwarded even if there is only partial overlap in the query duration.
File truncated at 100 lines see the full file
CONTRIBUTING

|
rmf_visualization repositoryrmf_visualization rmf_visualization_building_systems rmf_visualization_fleet_states rmf_visualization_rviz2_plugins rmf_visualization_schedule |
ROS Distro
|
Repository Summary
| Checkout URI | https://github.com/open-rmf/rmf_visualization.git |
| VCS Type | git |
| VCS Version | galactic |
| Last Updated | 2021-09-01 |
| Dev Status | DEVELOPED |
| Released | RELEASED |
| Contributing |
Help Wanted (-)
Good First Issues (-) Pull Requests to Review (-) |
Packages
| Name | Version |
|---|---|
| rmf_visualization | 1.2.1 |
| rmf_visualization_building_systems | 1.2.1 |
| rmf_visualization_fleet_states | 1.2.1 |
| rmf_visualization_rviz2_plugins | 1.2.1 |
| rmf_visualization_schedule | 1.2.1 |
README
rmf_schedule_visualizer
![]()
![]()
This repository contains several packages that aid with visualizing various entities within RMF via RViz.
- rmf_visualization_building_systems: to visualize the locations and states of lifts and doors in the facility.
- rmf_visualization_fleet_states: to visualize the location of robots from various fleets.
- rmf_visualization_schedule: to visualize the trajectories of participants in the RMF schedule database. This package also contains a websocket server that provides information on trajectories when queried.
- rmf_visualization_rviz2_plugins: Rviz plugins for customizing the view of the participant schedules and interacting with building systems.
- rmf_visualization: launch file to bring up the above systems

Installation
It is recommended to follow the instructions here to setup an RMF workspace with the packages in this repository along with other dependencies.
Run
To launch the visualizer
ros2 launch rmf_visualization visualization.launch.xml
An active rmf_traffic_schedule node is prerequisite for the visualizer to initialize. If a schedule node is not running, it can be started with the command
ros2 run rmf_traffic_ros2 rmf_traffic_schedule
Note: Only one instance of
rmf_traffic_schedulemust be active at any moment.
The various packages publish MarkerArray messages over these topics:
-
/map_markersvisualizes the nav graphs, waypoints and waypoint labels. Topic durability isTransient Local. -
/schedule_markersvisualizes planned trajectory of the robots in the rmf_schedule along with the robot vicinities. -
/fleet_markersrenders the current pose of robots as purple spheres -
/building_systems_markersvisualize the current states of doors and lifts in the facility. Topic durability isTransient Local.

For a given map_name, the rmf_visualization_schedule_data_node queries for trajectories in the RMF schedule database over a duration that is specified by start_duration and query_duration parameters.
The expected location and vicinity of a participant are visualized with concentric yellow and blue circles respectively.
The expected trajectory for a participant is a green polyline when conflict-free and is red otherwise.
The SchedulePanel in RViz allows users to modify the parameters used to query trajectories in the schedule database.
Door and Lift panels allow users to interact with these systems respectively.
The rmf.rviz file is used to save the configuration of RViz along with default values of parameters used in the different panels.
Websocket Server for Custom UIs
For developers looking to create custom UIs outside of the ROS2 environment, this repository provides a websocket server to exchange information contained in an active rmf schedule database. This may primarily be used to query for robot trajectories in the schedule along with conflict information if any. The format for various requests and corresponding responses are described below.
The websocket server starts up when visualization.launch.xml is launched.
Sample Client Requests
Server Time
To receive the current server time in milliseconds
{"request":"time","param":{}}
Sample server response
{"response":"time","values":[167165000000]}
Trajectories in RMF Schedule
To receive a list of active trajectories and conflicts if any between now and until a duration(milliseconds)
{"request":"trajectory","param":{"map_name":"L1","duration":60000, "trim":true}}
If trim is false, data of the complete trajectory is forwarded even if there is only partial overlap in the query duration.
Sample server response
{
  "response":"trajectory",
  "values":[{
    "robot_name":"tinyRobot_1",
    "fleet_name:"tinyRobot",
    "shape":"circle",
    "dimensions":0.3,
    "id":310,
    "segments":[
      {"t":336857,"v":[0.018886815933120995,0.4996431607843137,0.0],"x":[11.610485884950174,-8.054053944114406,-1.6085801124572754]},
      {"t":338700,"v":[0.01888681593558913,0.4996431608496359,0.0],"x":[11.645306833719362,-7.132879672805034,-1.6085801124572754]}]}],
  "conflicts":[]
}
Here segments is a list of dictionaries containing parameters of the knots in the piecewise cubic spline trajectory. x stores positional data in [x, y,theta] coordinates while v, the velocity data in the same coordinates. t is the time recorded in milliseconds.
CONTRIBUTING
|
|
rmf_visualization repositoryrmf_visualization rmf_visualization_building_systems rmf_visualization_fleet_states rmf_visualization_rviz2_plugins rmf_visualization_schedule |
ROS Distro
|
Repository Summary
| Checkout URI | https://github.com/open-rmf/rmf_visualization.git |
| VCS Type | git |
| VCS Version | foxy |
| Last Updated | 2021-09-01 |
| Dev Status | DEVELOPED |
| Released | RELEASED |
| Contributing |
Help Wanted (-)
Good First Issues (-) Pull Requests to Review (-) |
Packages
| Name | Version |
|---|---|
| rmf_visualization | 1.2.1 |
| rmf_visualization_building_systems | 1.2.1 |
| rmf_visualization_fleet_states | 1.2.1 |
| rmf_visualization_rviz2_plugins | 1.2.1 |
| rmf_visualization_schedule | 1.2.1 |
README
rmf_schedule_visualizer
![]()
![]()
This repository contains several packages that aid with visualizing various entities within RMF via RViz.
- rmf_visualization_building_systems: to visualize the locations and states of lifts and doors in the facility.
- rmf_visualization_fleet_states: to visualize the location of robots from various fleets.
- rmf_visualization_schedule: to visualize the trajectories of participants in the RMF schedule database. This package also contains a websocket server that provides information on trajectories when queried.
- rmf_visualization_rviz2_plugins: Rviz plugins for customizing the view of the participant schedules and interacting with building systems.
- rmf_visualization: launch file to bring up the above systems
Installation
It is recommended to follow the instructions here to setup an RMF workspace with the packages in this repository along with other dependencies.
Run
To launch the visualizer
ros2 launch rmf_visualization visualization.launch.xml
An active rmf_traffic_schedule node is prerequisite for the visualizer to initialize. If a schedule node is not running, it can be started with the command
ros2 run rmf_traffic_ros2 rmf_traffic_schedule
Note: Only one instance of
rmf_traffic_schedulemust be active at any moment.
The various packages publish MarkerArray messages over these topics:
-
/map_markersvisualizes the nav graphs, waypoints and waypoint labels. Topic durability isTransient Local. -
/schedule_markersvisualizes planned trajectory of the robots in the rmf_schedule along with the robot vicinities. -
/fleet_markersrenders the current pose of robots as purple spheres -
/building_systems_markersvisualize the current states of doors and lifts in the facility. Topic durability isTransient Local.

For a given map_name, the rmf_visualization_schedule_data_node queries for trajectories in the RMF schedule database over a duration that is specified by start_duration and query_duration parameters.
The expected location and vicinity of a participant are visualized with concentric yellow and blue circles respectively.
The expected trajectory for a participant is a green polyline when conflict-free and is red otherwise.
The SchedulePanel in RViz allows users to modify the parameters used to query trajectories in the schedule database.
Door and Lift panels allow users to interact with these systems respectively.
The rmf.rviz file is used to save the configuration of RViz along with default values of parameters used in the different panels.
Websocket Server for Custom UIs
For developers looking to create custom UIs outside of the ROS2 environment, this repository provides a websocket server to exchange information contained in an active rmf schedule database. This may primarily be used to query for robot trajectories in the schedule along with conflict information if any. The format for various requests and corresponding responses are described below.
The websocket server starts up when visualization.launch.xml is launched.
Sample Client Requests
Server Time
To receive the current server time in milliseconds
{"request":"time","param":{}}
Sample server response
{"response":"time","values":[167165000000]}
Trajectories in RMF Schedule
To receive a list of active trajectories and conflicts if any between now and until a duration(milliseconds)
{"request":"trajectory","param":{"map_name":"L1","duration":60000, "trim":true}}
If trim is false, data of the complete trajectory is forwarded even if there is only partial overlap in the query duration.
Sample server response
{
  "response":"trajectory",
  "values":[{
    "robot_name":"tinyRobot_1",
    "fleet_name:"tinyRobot",
    "shape":"circle",
    "dimensions":0.3,
    "id":310,
    "segments":[
      {"t":336857,"v":[0.018886815933120995,0.4996431607843137,0.0],"x":[11.610485884950174,-8.054053944114406,-1.6085801124572754]},
      {"t":338700,"v":[0.01888681593558913,0.4996431608496359,0.0],"x":[11.645306833719362,-7.132879672805034,-1.6085801124572754]}]}],
  "conflicts":[]
}
Here segments is a list of dictionaries containing parameters of the knots in the piecewise cubic spline trajectory. x stores positional data in [x, y,theta] coordinates while v, the velocity data in the same coordinates. t is the time recorded in milliseconds.
CONTRIBUTING
Repository Summary
| Checkout URI | https://github.com/open-rmf/rmf_visualization.git |
| VCS Type | git |
| VCS Version | iron |
| Last Updated | 2024-03-28 |
| Dev Status | DEVELOPED |
| Released | RELEASED |
| Contributing |
Help Wanted (-)
Good First Issues (-) Pull Requests to Review (-) |
Packages
| Name | Version |
|---|---|
| rmf_visualization | 2.1.2 |
| rmf_visualization_building_systems | 2.1.2 |
| rmf_visualization_fleet_states | 2.1.2 |
| rmf_visualization_floorplans | 2.1.2 |
| rmf_visualization_navgraphs | 2.1.2 |
| rmf_visualization_obstacles | 2.1.2 |
| rmf_visualization_rviz2_plugins | 2.1.2 |
| rmf_visualization_schedule | 2.1.2 |
README
Open-RMF Visualization
![]()
![]()
![]()
This repository contains several packages that aid with visualizing various entities within RMF via RViz.
- rmf_visualization
- rmf_visualization_building_systems
- rmf_visualization_fleet_states
- rmf_visualization_floorplans
- rmf_visualization_navgraphs
- rmf_visualization_obstacles
- rmf_visualization_rviz2_plugins
- rmf_visualization_schedule
Installation
It is recommended to follow the instructions here to setup an RMF workspace with the packages in this repository along with other dependencies.
rmf_visualization
A package that contains the main launch file to bringup all the visualizers. Descriptions of various configurable parameters is provided within the launch file.
To launch the visualizer
ros2 launch rmf_visualization visualization.launch.xml
rmf_visualization_building_systems
A visualizer for lifts and doors in the facility. The ROS 2 node subscribes to DoorState and LiftState ROS 2 messages published over /door_states and /lift_states topics. It then publishes RViz markers depicting the location and status of these systems over /building_systems_markers with Transient Local durability.
rmf_visualization_fleet_states
A visualizer for the current positions of various robot as reported by their fleet managers. The ROS 2 node subscribes to FleetState ROS 2 messages published over /fleet_states. It then publishes RViz markers depicting the location of the robots over /fleet_markers.
rmf_visualization_floorplans
A visualizer for the floorplan images for each building level. The ROS 2 node subscribes to BuildingMap ROS 2 messages published over /map. It then converts the image to an OccupancyGrid and publishes it over /floorplan.
rmf_visualization_navgraphs
https://user-images.githubusercontent.com/13482049/176585472-115ef57b-7792-4f02-93d3-c50a3ad70c95.mp4
A visualizer for the navigation graphs used by each fleet of robots. Lanes that are closed are shared grey while speed limited ones have relatively narrower widths. The ROS 2 node subscribes to Graph ROS 2 messages published over /nav_graphs. It then publishes RViz markers depicting color coded lanes for each fleet over /map_markers with Transient Local durability.
rmf_visualization_obstacles
A visualizer for obstacles detected. The ROS 2 node subscribes to Obstacles ROS 2 messages published over /rmf_obstacles. It then publishes RViz markers depicting the obstacles over /fleet_markers with Transient Local durability.
rmf_visualization_rviz2_plugins
 This package provides several RViz panels to update the view and submit requests to Open-RMF.
RMFSchedulePanel
For a given map_name, the rmf_visualization_schedule_data_node queries for trajectories in the RMF schedule database over a duration that is specified by start_duration and query_duration parameters.
The expected location and vicinity of a participant are visualized with concentric yellow and blue circles respectively.
The expected trajectory for a participant is a green polyline when conflict-free and is red otherwise.
The SchedulePanel in RViz allows users to modify the parameters used to query trajectories in the schedule database.
Door and Lift panels
Door and Lift panels allow users to interact with these systems respectively.
The rmf.rviz file is used to save the configuration of RViz along with default values of parameters used in the different panels.
rmf_visualization_schedule

A visualizer of the predicted schedule of robots as submitted by fleet adapters to the RMF Schedule Database. The ROS 2 node spawns a Mirror of the RMF Schedule Database which is queries before publishing markers depicting the trajectory of robots as green line strips to /schedule_markers. The footprint and vicinity of each robot is represented by yellow and cyan cylindrical markers respectively.
An active rmf_traffic_schedule node is prerequisite for the visualizer to initialize. If a schedule node is not running, it can be started with the command
ros2 run rmf_traffic_ros2 rmf_traffic_schedule
Note: Only one instance of
rmf_traffic_schedulemust be active at any moment.
Websocket Server for Custom UIs
For developers looking to create custom UIs outside of the ROS2 environment, this repository provides a websocket server to exchange information contained in an active rmf schedule database. This may primarily be used to query for robot trajectories in the schedule along with conflict information if any. The format for various requests and corresponding responses are described below.
The websocket server starts up when visualization.launch.xml is launched.
Sample Client Requests
Server Time
To receive the current server time in milliseconds
{"request":"time","param":{}}
Sample server response
{"response":"time","values":[167165000000]}
Trajectories in RMF Schedule
To receive a list of active trajectories and conflicts if any between now and until a duration(milliseconds)
{"request":"trajectory","param":{"map_name":"L1","duration":60000, "trim":true}}
If trim is false, data of the complete trajectory is forwarded even if there is only partial overlap in the query duration.
File truncated at 100 lines see the full file
CONTRIBUTING
Repository Summary
| Checkout URI | https://github.com/open-rmf/rmf_visualization.git |
| VCS Type | git |
| VCS Version | humble |
| Last Updated | 2024-05-24 |
| Dev Status | DEVELOPED |
| Released | RELEASED |
| Contributing |
Help Wanted (-)
Good First Issues (-) Pull Requests to Review (-) |
Packages
| Name | Version |
|---|---|
| rmf_visualization | 2.0.2 |
| rmf_visualization_building_systems | 2.0.2 |
| rmf_visualization_fleet_states | 2.0.2 |
| rmf_visualization_floorplans | 2.0.2 |
| rmf_visualization_navgraphs | 2.0.2 |
| rmf_visualization_obstacles | 2.0.2 |
| rmf_visualization_rviz2_plugins | 2.0.2 |
| rmf_visualization_schedule | 2.0.2 |
README
Open-RMF Visualization
![]()
![]()
![]()
This repository contains several packages that aid with visualizing various entities within RMF via RViz.
- rmf_visualization
- rmf_visualization_building_systems
- rmf_visualization_fleet_states
- rmf_visualization_floorplans
- rmf_visualization_navgraphs
- rmf_visualization_obstacles
- rmf_visualization_rviz2_plugins
- rmf_visualization_schedule
Installation
It is recommended to follow the instructions here to setup an RMF workspace with the packages in this repository along with other dependencies.
rmf_visualization
A package that contains the main launch file to bringup all the visualizers. Descriptions of various configurable parameters is provided within the launch file.
To launch the visualizer
ros2 launch rmf_visualization visualization.launch.xml
rmf_visualization_building_systems
A visualizer for lifts and doors in the facility. The ROS 2 node subscribes to DoorState and LiftState ROS 2 messages published over /door_states and /lift_states topics. It then publishes RViz markers depicting the location and status of these systems over /building_systems_markers with Transient Local durability.
rmf_visualization_fleet_states
A visualizer for the current positions of various robot as reported by their fleet managers. The ROS 2 node subscribes to FleetState ROS 2 messages published over /fleet_states. It then publishes RViz markers depicting the location of the robots over /fleet_markers.
rmf_visualization_floorplans
A visualizer for the floorplan images for each building level. The ROS 2 node subscribes to BuildingMap ROS 2 messages published over /map. It then converts the image to an OccupancyGrid and publishes it over /floorplan.
rmf_visualization_navgraphs
https://user-images.githubusercontent.com/13482049/176585472-115ef57b-7792-4f02-93d3-c50a3ad70c95.mp4
A visualizer for the navigation graphs used by each fleet of robots. Lanes that are closed are shared grey while speed limited ones have relatively narrower widths. The ROS 2 node subscribes to Graph ROS 2 messages published over /nav_graphs. It then publishes RViz markers depicting color coded lanes for each fleet over /map_markers with Transient Local durability.
rmf_visualization_obstacles
A visualizer for obstacles detected. The ROS 2 node subscribes to Obstacles ROS 2 messages published over /rmf_obstacles. It then publishes RViz markers depicting the obstacles over /fleet_markers with Transient Local durability.
rmf_visualization_rviz2_plugins
This package provides several RViz panels to update the view and submit requests to Open-RMF.
RMFSchedulePanel
For a given map_name, the rmf_visualization_schedule_data_node queries for trajectories in the RMF schedule database over a duration that is specified by start_duration and query_duration parameters.
The expected location and vicinity of a participant are visualized with concentric yellow and blue circles respectively.
The expected trajectory for a participant is a green polyline when conflict-free and is red otherwise.
The SchedulePanel in RViz allows users to modify the parameters used to query trajectories in the schedule database.
Door and Lift panels
Door and Lift panels allow users to interact with these systems respectively.
The rmf.rviz file is used to save the configuration of RViz along with default values of parameters used in the different panels.
rmf_visualization_schedule
A visualizer of the predicted schedule of robots as submitted by fleet adapters to the RMF Schedule Database. The ROS 2 node spawns a Mirror of the RMF Schedule Database which is queries before publishing markers depicting the trajectory of robots as green line strips to /schedule_markers. The footprint and vicinity of each robot is represented by yellow and cyan cylindrical markers respectively.
An active rmf_traffic_schedule node is prerequisite for the visualizer to initialize. If a schedule node is not running, it can be started with the command
ros2 run rmf_traffic_ros2 rmf_traffic_schedule
Note: Only one instance of
rmf_traffic_schedulemust be active at any moment.
Websocket Server for Custom UIs
For developers looking to create custom UIs outside of the ROS2 environment, this repository provides a websocket server to exchange information contained in an active rmf schedule database. This may primarily be used to query for robot trajectories in the schedule along with conflict information if any. The format for various requests and corresponding responses are described below.
The websocket server starts up when visualization.launch.xml is launched.
Sample Client Requests
Server Time
To receive the current server time in milliseconds
{"request":"time","param":{}}
Sample server response
{"response":"time","values":[167165000000]}
Trajectories in RMF Schedule
To receive a list of active trajectories and conflicts if any between now and until a duration(milliseconds)
{"request":"trajectory","param":{"map_name":"L1","duration":60000, "trim":true}}
If trim is false, data of the complete trajectory is forwarded even if there is only partial overlap in the query duration.
File truncated at 100 lines see the full file
CONTRIBUTING
Repository Summary
| Checkout URI | https://github.com/open-rmf/rmf_visualization.git |
| VCS Type | git |
| VCS Version | humble |
| Last Updated | 2024-05-24 |
| Dev Status | DEVELOPED |
| Released | RELEASED |
| Contributing |
Help Wanted (-)
Good First Issues (-) Pull Requests to Review (-) |
Packages
| Name | Version |
|---|---|
| rmf_visualization | 2.0.2 |
| rmf_visualization_building_systems | 2.0.2 |
| rmf_visualization_fleet_states | 2.0.2 |
| rmf_visualization_floorplans | 2.0.2 |
| rmf_visualization_navgraphs | 2.0.2 |
| rmf_visualization_obstacles | 2.0.2 |
| rmf_visualization_rviz2_plugins | 2.0.2 |
| rmf_visualization_schedule | 2.0.2 |
README
Open-RMF Visualization
![]()
![]()
![]()
This repository contains several packages that aid with visualizing various entities within RMF via RViz.
- rmf_visualization
- rmf_visualization_building_systems
- rmf_visualization_fleet_states
- rmf_visualization_floorplans
- rmf_visualization_navgraphs
- rmf_visualization_obstacles
- rmf_visualization_rviz2_plugins
- rmf_visualization_schedule
Installation
It is recommended to follow the instructions here to setup an RMF workspace with the packages in this repository along with other dependencies.
rmf_visualization
A package that contains the main launch file to bringup all the visualizers. Descriptions of various configurable parameters is provided within the launch file.
To launch the visualizer
ros2 launch rmf_visualization visualization.launch.xml
rmf_visualization_building_systems
A visualizer for lifts and doors in the facility. The ROS 2 node subscribes to DoorState and LiftState ROS 2 messages published over /door_states and /lift_states topics. It then publishes RViz markers depicting the location and status of these systems over /building_systems_markers with Transient Local durability.
rmf_visualization_fleet_states
A visualizer for the current positions of various robot as reported by their fleet managers. The ROS 2 node subscribes to FleetState ROS 2 messages published over /fleet_states. It then publishes RViz markers depicting the location of the robots over /fleet_markers.
rmf_visualization_floorplans
A visualizer for the floorplan images for each building level. The ROS 2 node subscribes to BuildingMap ROS 2 messages published over /map. It then converts the image to an OccupancyGrid and publishes it over /floorplan.
rmf_visualization_navgraphs
https://user-images.githubusercontent.com/13482049/176585472-115ef57b-7792-4f02-93d3-c50a3ad70c95.mp4
A visualizer for the navigation graphs used by each fleet of robots. Lanes that are closed are shared grey while speed limited ones have relatively narrower widths. The ROS 2 node subscribes to Graph ROS 2 messages published over /nav_graphs. It then publishes RViz markers depicting color coded lanes for each fleet over /map_markers with Transient Local durability.
rmf_visualization_obstacles
A visualizer for obstacles detected. The ROS 2 node subscribes to Obstacles ROS 2 messages published over /rmf_obstacles. It then publishes RViz markers depicting the obstacles over /fleet_markers with Transient Local durability.
rmf_visualization_rviz2_plugins
This package provides several RViz panels to update the view and submit requests to Open-RMF.
RMFSchedulePanel
For a given map_name, the rmf_visualization_schedule_data_node queries for trajectories in the RMF schedule database over a duration that is specified by start_duration and query_duration parameters.
The expected location and vicinity of a participant are visualized with concentric yellow and blue circles respectively.
The expected trajectory for a participant is a green polyline when conflict-free and is red otherwise.
The SchedulePanel in RViz allows users to modify the parameters used to query trajectories in the schedule database.
Door and Lift panels
Door and Lift panels allow users to interact with these systems respectively.
The rmf.rviz file is used to save the configuration of RViz along with default values of parameters used in the different panels.
rmf_visualization_schedule
A visualizer of the predicted schedule of robots as submitted by fleet adapters to the RMF Schedule Database. The ROS 2 node spawns a Mirror of the RMF Schedule Database which is queries before publishing markers depicting the trajectory of robots as green line strips to /schedule_markers. The footprint and vicinity of each robot is represented by yellow and cyan cylindrical markers respectively.
An active rmf_traffic_schedule node is prerequisite for the visualizer to initialize. If a schedule node is not running, it can be started with the command
ros2 run rmf_traffic_ros2 rmf_traffic_schedule
Note: Only one instance of
rmf_traffic_schedulemust be active at any moment.
Websocket Server for Custom UIs
For developers looking to create custom UIs outside of the ROS2 environment, this repository provides a websocket server to exchange information contained in an active rmf schedule database. This may primarily be used to query for robot trajectories in the schedule along with conflict information if any. The format for various requests and corresponding responses are described below.
The websocket server starts up when visualization.launch.xml is launched.
Sample Client Requests
Server Time
To receive the current server time in milliseconds
{"request":"time","param":{}}
Sample server response
{"response":"time","values":[167165000000]}
Trajectories in RMF Schedule
To receive a list of active trajectories and conflicts if any between now and until a duration(milliseconds)
{"request":"trajectory","param":{"map_name":"L1","duration":60000, "trim":true}}
If trim is false, data of the complete trajectory is forwarded even if there is only partial overlap in the query duration.
File truncated at 100 lines see the full file