Repository Summary
| Checkout URI | https://github.com/NVIDIA-ISAAC-ROS/greenwave_monitor.git |
| VCS Type | git |
| VCS Version | main |
| Last Updated | 2026-02-27 |
| Dev Status | MAINTAINED |
| Released | RELEASED |
| Contributing |
Help Wanted (-)
Good First Issues (-) Pull Requests to Review (-) |
Packages
| Name | Version |
|---|---|
| greenwave_monitor | 1.0.0 |
| greenwave_monitor_interfaces | 1.0.0 |
README
Greenwave Monitor
Greenwave monitor is a tool for runtime monitoring of ROS 2 topics.
It provides the following features:
-
A node similar to a C++ based ros2 topic hz. i.e. subscribes to topics to determine the frame rate and latency. Compared to ros2 topic hz the greenwave node is more performant, publishes Diagnostics, and offers services to manage topics and expected frequencies.
-
A terminal based dashboard that displays the topic rates, latency, and status, and allows you to add/remove topics and set expected frequencies.
-
A header only C++ library so you can calculate and publish compatible diagnostics directly from your own nodes for reduced overhead.
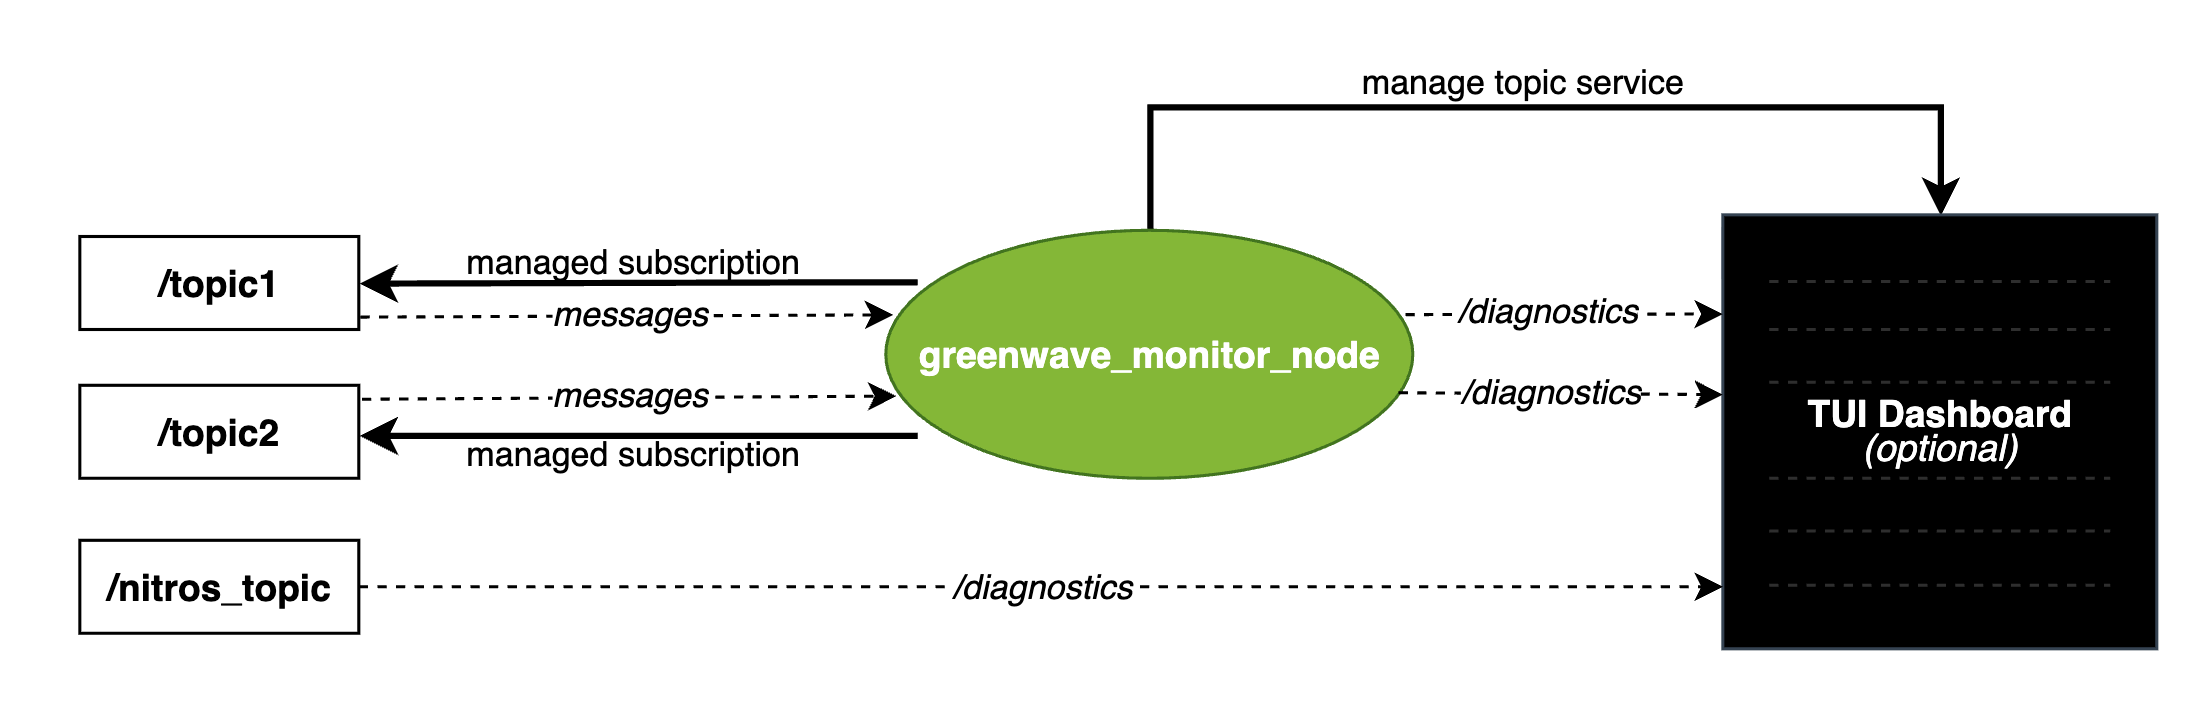
This diagram shows an overview of the architecture:
For implementation details and inline integration guidance, see
docs/DESIGN_AND_IMPLEMENTATION.md.
Compatibility
Greenwave monitor is a standalone package tested on Humble, Iron, Jazzy, Kilted, and Rolling ROS 2 releases, under Ubuntu 22.04 and Ubuntu 24.04. It does not depend on Isaac ROS. It does however play nicely with Isaac ROS NITROS diagnostics, see docs/DESIGN_AND_IMPLEMENTATION.md for more.
Installation
From source:
cd ros_ws/src
git clone https://github.com/NVIDIA-ISAAC-ROS/greenwave_monitor.git
cd ..
colcon build --packages-up-to greenwave_monitor
source install/setup.bash
Usage
Greenwave monitor provides a lightweight ncurses dashboard for monitoring topics. An optional rich TUI (r2s integration) with additional features is also available as a separate package.
ncurses Dashboard
After installing, you can launch the ncurses dashboard with:
ros2 run greenwave_monitor ncurses_dashboard
You can also launch the dashboard with some demo publishers to see everything in action:
ros2 run greenwave_monitor ncurses_dashboard --demo
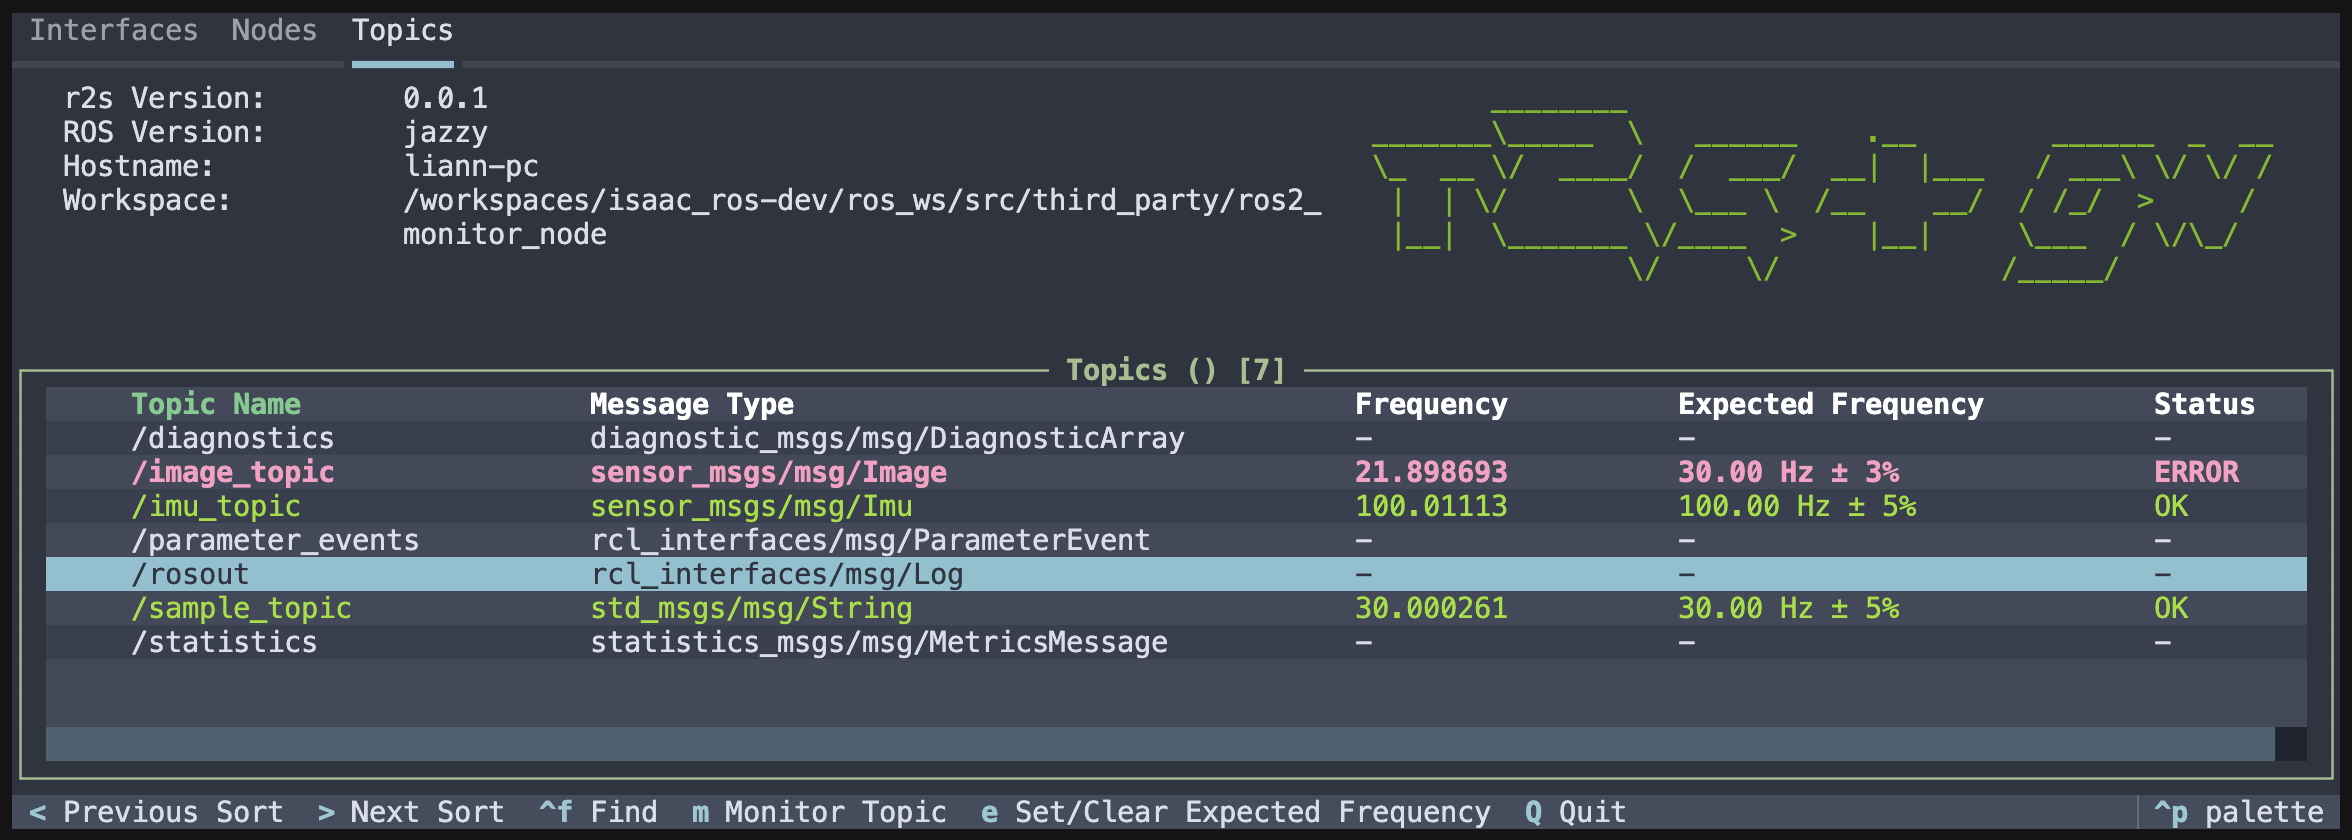
Rich TUI (r2s integration) - Optional
For users who want an advanced, feature-rich terminal interface, r2s_gw is available as a separate package. Built on the excellent r2s TUI framework and powered by Textual, r2s_gw provides a beautiful, modern interface with enhanced navigation and visualization capabilities.
r2s_gw is perfect for interactive development and debugging sessions. For deployments with many topics or minimal dependency requirements, the lightweight ncurses dashboard above is recommended.
To use r2s_gw:
- Clone the r2s_gw repository into a workspace:
mkdir -p ~/ros_ws/src
cd ~/ros_ws/src
git clone https://github.com/NVIDIA-ISAAC-ROS/r2s_gw.git
- Install dependencies and build:
pip install --ignore-installed pygments -r r2s_gw/requirements.txt
cd ~/ros_ws
colcon build --packages-select r2s_gw
source install/setup.bash
- Launch the dashboard (use tab to navigate between UI elements):
ros2 run r2s_gw r2s_gw_dashboard
- Or launch with demo publishers:
ros2 run r2s_gw r2s_gw_dashboard -- --demo
Manual Launch (ros2 topic hz mode)
You can also launch the node standalone, or incorporate it into your own launch files. If you want to use it as a command line tool, you can do so with the following launch file:
ros2 launch greenwave_monitor hz.launch.py gw_monitored_topics:='["/topic1", "/topic2"]'
Inline Integration Example Node
For a minimal C++ reference implementation that publishes both data and greenwave diagnostics:
File truncated at 100 lines see the full file
CONTRIBUTING
Repository Summary
| Checkout URI | https://github.com/NVIDIA-ISAAC-ROS/greenwave_monitor.git |
| VCS Type | git |
| VCS Version | main |
| Last Updated | 2026-02-27 |
| Dev Status | MAINTAINED |
| Released | RELEASED |
| Contributing |
Help Wanted (-)
Good First Issues (-) Pull Requests to Review (-) |
Packages
| Name | Version |
|---|---|
| greenwave_monitor | 1.0.0 |
| greenwave_monitor_interfaces | 1.0.0 |
README
Greenwave Monitor
Greenwave monitor is a tool for runtime monitoring of ROS 2 topics.
It provides the following features:
-
A node similar to a C++ based ros2 topic hz. i.e. subscribes to topics to determine the frame rate and latency. Compared to ros2 topic hz the greenwave node is more performant, publishes Diagnostics, and offers services to manage topics and expected frequencies.
-
A terminal based dashboard that displays the topic rates, latency, and status, and allows you to add/remove topics and set expected frequencies.
-
A header only C++ library so you can calculate and publish compatible diagnostics directly from your own nodes for reduced overhead.
This diagram shows an overview of the architecture:
For implementation details and inline integration guidance, see
docs/DESIGN_AND_IMPLEMENTATION.md.
Compatibility
Greenwave monitor is a standalone package tested on Humble, Iron, Jazzy, Kilted, and Rolling ROS 2 releases, under Ubuntu 22.04 and Ubuntu 24.04. It does not depend on Isaac ROS. It does however play nicely with Isaac ROS NITROS diagnostics, see docs/DESIGN_AND_IMPLEMENTATION.md for more.
Installation
From source:
cd ros_ws/src
git clone https://github.com/NVIDIA-ISAAC-ROS/greenwave_monitor.git
cd ..
colcon build --packages-up-to greenwave_monitor
source install/setup.bash
Usage
Greenwave monitor provides a lightweight ncurses dashboard for monitoring topics. An optional rich TUI (r2s integration) with additional features is also available as a separate package.
ncurses Dashboard
After installing, you can launch the ncurses dashboard with:
ros2 run greenwave_monitor ncurses_dashboard
You can also launch the dashboard with some demo publishers to see everything in action:
ros2 run greenwave_monitor ncurses_dashboard --demo
Rich TUI (r2s integration) - Optional
For users who want an advanced, feature-rich terminal interface, r2s_gw is available as a separate package. Built on the excellent r2s TUI framework and powered by Textual, r2s_gw provides a beautiful, modern interface with enhanced navigation and visualization capabilities.
r2s_gw is perfect for interactive development and debugging sessions. For deployments with many topics or minimal dependency requirements, the lightweight ncurses dashboard above is recommended.
To use r2s_gw:
- Clone the r2s_gw repository into a workspace:
mkdir -p ~/ros_ws/src
cd ~/ros_ws/src
git clone https://github.com/NVIDIA-ISAAC-ROS/r2s_gw.git
- Install dependencies and build:
pip install --ignore-installed pygments -r r2s_gw/requirements.txt
cd ~/ros_ws
colcon build --packages-select r2s_gw
source install/setup.bash
- Launch the dashboard (use tab to navigate between UI elements):
ros2 run r2s_gw r2s_gw_dashboard
- Or launch with demo publishers:
ros2 run r2s_gw r2s_gw_dashboard -- --demo
Manual Launch (ros2 topic hz mode)
You can also launch the node standalone, or incorporate it into your own launch files. If you want to use it as a command line tool, you can do so with the following launch file:
ros2 launch greenwave_monitor hz.launch.py gw_monitored_topics:='["/topic1", "/topic2"]'
Inline Integration Example Node
For a minimal C++ reference implementation that publishes both data and greenwave diagnostics:
File truncated at 100 lines see the full file