 ROS Index
Repository Summary
| Checkout URI | https://github.com/TanayK07/ros2_pulse.git |
| VCS Type | git |
| VCS Version | main |
| Last Updated | 2026-10-02 |
| Dev Status | DEVELOPED |
| Released | RELEASED |
| Contributing |
Help Wanted (-)
Good First Issues (-) Pull Requests to Review (-) |
Packages
| Name | Version |
|---|---|
| ros2_pulse | 0.5.0 |
README
ros2_pulse
The heartbeat of your ROS 2 graph. A low-overhead probe that measures per-topic message rate and active-node liveness for both inter-process and intra-process traffic, on stock ROS 2 binaries, with no rebuild, no privileges and no network traffic. The counting hot path costs under a nanosecond per message; the whole probe costs about 2 % of workload CPU on a harsh 4,900 msg/s stress and less on real graphs.




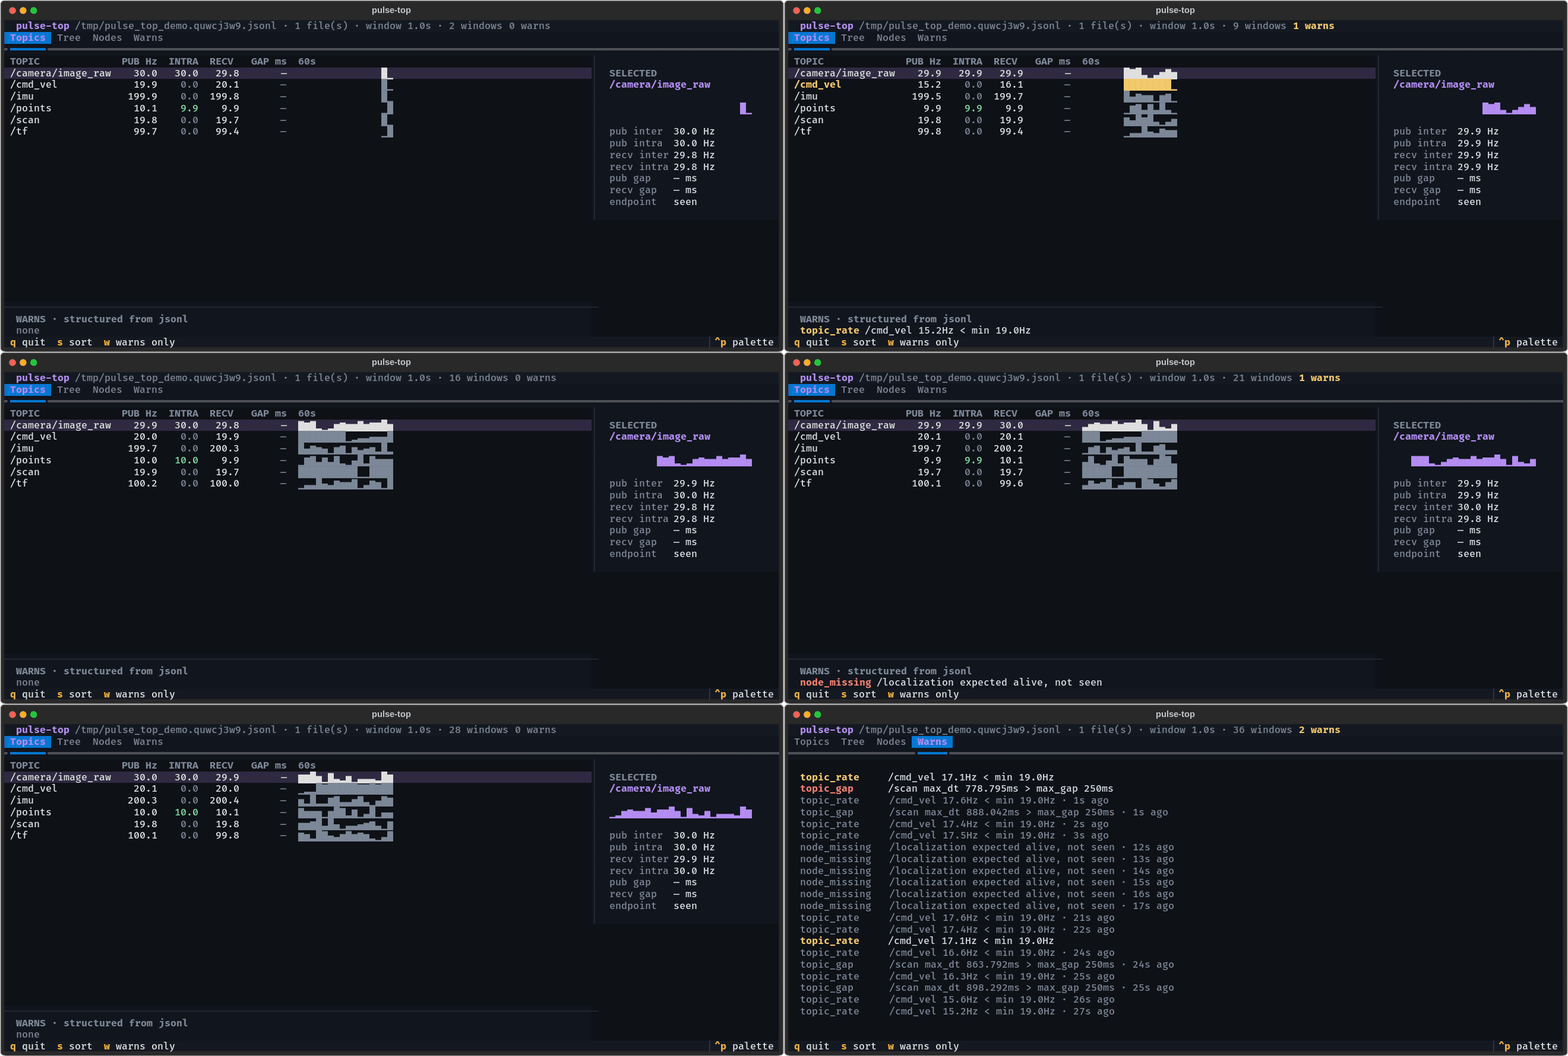
pulse-top --demo: the probe’s log, live. Sparklines per topic, intra-process rates, structured warnings with ages. Install: pip3 install ros2-pulse-top (details).
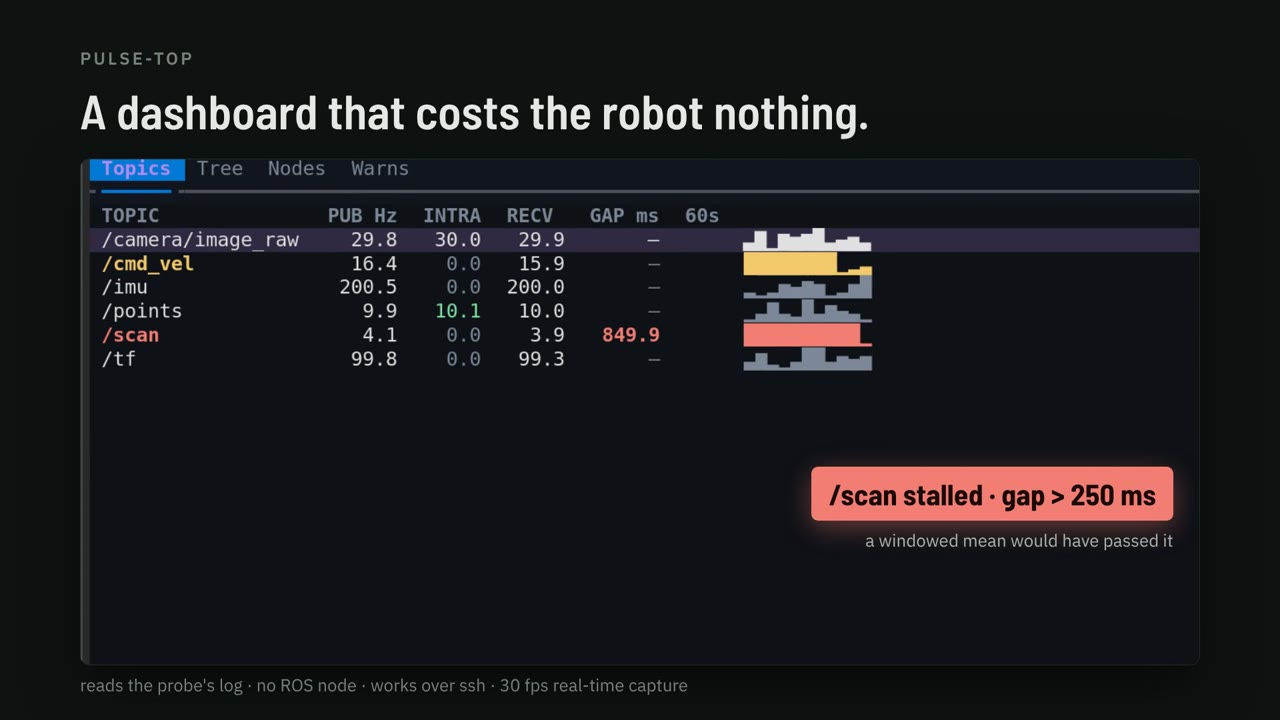
Forty seconds on what watching a topic costs and what the probe does instead. Watch the video (40 s, YouTube) or read the docs.
The long version, for systems programmers: Watching a ROS 2 topic changes it, the observer-effect measurement and the symbol-interposition trick that avoids it.
Why
The question in production is simple: is every topic flowing at the rate it should, and which nodes are alive? The existing tools each fall short of answering it.
-
ros2 topic hzandros2 topic echosubscribe to one topic at a time. Watching a single 100 KB topic costs 7 % of a core withhzand 31 % withecho, they cannot see intra-process messages at all, and pointinghzat an intra-process topic makes the publisher start serializing every message, which raised the watched process’s CPU by 52 % in our measurements. - Built-in topic statistics are
bypassed by intra-process comms on Humble-class
binaries, so composable nodes carrying point clouds lose all introspection. This is fixed on
rollingand newer by rclcpp#3130 (merged April 2026); there is no public Humble backport as of this writing. -
ros2_tracing/ LTTng is built for offline analysis: a session daemon plus post-processing of a CTF trace just to get a rate. On Humble it also needs ROS rebuilt with the lttng-ust backend (Jazzy and newer trace out of the box). - CARET (Tier IV) uses the same hook layer as this probe, LD_PRELOAD over tracetools, which is a useful independent validation of the mechanism. It is built for deep offline latency and chain analysis and needs LTTng, a forked rclcpp and Jupyter post-processing. Complementary, not always-on.
- eBPF uprobes need
CAP_SYS_ADMIN, debugfs and a kernel with BTF and uprobes, which is often a non-starter on Jetson and other embedded targets, and they pay a kernel trap per message.
ros2_pulse hooks the tracetools instrumentation layer that rclcpp already calls on every
publish and every callback, counts in-process with a lock-free hot path, and writes ready-to-read
Hz to a small rolling file.
What you get
# ts_ns=1782887153899445923 window_s=5.000
TOPIC /scan 20.000000                      # publish-side, inter-process
PUB   /points inter=0.000000 intra=30.000000   # publish-side incl. intra (Iron+)
RECV  /scan inter=20.000000 intra=0.000000 # receive-side, BOTH transports
RECV  /points inter=0.000000 intra=30.000000   # <- intra-process, invisible to other tools on Humble
JITTER /scan recv max_dt_ms=21.284             # largest inter-arrival gap (opt-in, see below)
NODE  /perception
NODE  /planner
WARN  TOPIC /scan hz=1.200000 expected=[18,22]  # only with an expected-rate spec (see below)
If a sidecar exporter or a log shipper is reading instead of a person, ROS_TOPIC_STATS_FORMAT=jsonl
writes every window as one JSON object per line with the same gates and values. See
JSON Lines output. Dashboards that already
read rclcpp’s built-in topic statistics get the same numbers on /statistics from the
pulse_bridge sidecar, and Prometheus, OTLP and
Grafana get them from pulse-export.
How it works
libros2_pulse.so is injected with LD_PRELOAD. It exports the same symbols as
libtracetools.so’s tracepoint API (ros_trace_rcl_publish, ros_trace_callback_start, the
init tracepoints and so on). The dynamic linker binds rclcpp’s calls to ours first; each
interposer records a stat and forwards to the real function through dlsym(RTLD_NEXT, ...).
rclcpp calls these functions unconditionally (the LTTng enable check is inside them), so the
probe works with no tracing session and adds no DDS traffic.
- Intra-process visibility comes from
callback_start(callback, is_intra_process), which fires for every subscription callback regardless of transport. - The hot path is a per-endpoint relaxed atomic increment behind a 256-slot thread-local cache with a stride-breaking hash. No global lock, no per-message string hashing. Counting costs about 0.3 ns/op on a fixed endpoint and 0.6 to 1.2 ns/op alternating across a working set on the reference box, two orders of magnitude under a single LTTng-UST tracepoint (about 158 ns).
- A background timer snapshots and resets the counts every
ROS_TOPIC_STATISTICS_PUBLISH_PERIODseconds and appends the rates toROS_TOPIC_STATS_OUTPUT_FILE.
The pure C++ core (core/) has no ROS dependency and is unit tested on its own; the probe layer
(probe/) is a thin LD_PRELOAD shim.
Install
apt
File truncated at 100 lines see the full file
CONTRIBUTING
Contributing to ros2_pulse
Thanks for your interest. This is a small, focused package; contributions that keep it small and focused are the most welcome.
Ground rules
-
The core stays pure.
include/ros2_pulse/core/andsrc/core/must not depend on ROS, rclcpp, or tracetools. All ROS/tracetools coupling lives insrc/probe/. This is what keeps the logic unit-testable in isolation. -
The hot path stays cheap.
onPublish/onCallbackStartrun per message. No allocations, no string hashing, no global locks, per-endpoint atomics + the thread-local cache only. - No DDS traffic, no privileges. The probe writes a local file and opens no sockets. Keep it that way.
Dev workflow
# unit tests (pure core, no ROS): the fastest loop
GT=/opt/ros/humble/src/gtest_vendor
g++ -O2 -std=c++17 -pthread -Iinclude -I$GT/include -I$GT \
  test/unit/test_topic_registry.cpp src/core/topic_registry.cpp $GT/src/gtest-all.cc -o /tmp/ut && /tmp/ut

# full suite (unit + integration)
colcon build --packages-select ros2_pulse
colcon test --packages-select ros2_pulse && colcon test-result --verbose

# benchmark / overhead (see bench/README.md)
Pull requests
- Add or update tests for any behavior change (
test/unitfor core,test/integrationfor the probe end-to-end). - Run
colcon testand include the result in the PR. - For performance-affecting changes, run
bench/run_overhead_repeated.shand paste the numbers. - Keep commits conventional (
feat:,fix:,perf:,docs:,test:).
Reporting bugs
Open an issue with: ROS distro, RMW (FastRTPS/CycloneDDS), whether intra-process comms are on, the
relevant pulse.log window, and nm -D libtracetools.so | grep -c ros_trace output.
Repository Summary
| Checkout URI | https://github.com/TanayK07/ros2_pulse.git |
| VCS Type | git |
| VCS Version | main |
| Last Updated | 2026-10-02 |
| Dev Status | DEVELOPED |
| Released | RELEASED |
| Contributing |
Help Wanted (-)
Good First Issues (-) Pull Requests to Review (-) |
Packages
| Name | Version |
|---|---|
| ros2_pulse | 0.5.0 |
README
ros2_pulse
The heartbeat of your ROS 2 graph. A low-overhead probe that measures per-topic message rate and active-node liveness for both inter-process and intra-process traffic, on stock ROS 2 binaries, with no rebuild, no privileges and no network traffic. The counting hot path costs under a nanosecond per message; the whole probe costs about 2 % of workload CPU on a harsh 4,900 msg/s stress and less on real graphs.
pulse-top --demo: the probe’s log, live. Sparklines per topic, intra-process rates, structured warnings with ages. Install: pip3 install ros2-pulse-top (details).
Forty seconds on what watching a topic costs and what the probe does instead. Watch the video (40 s, YouTube) or read the docs.
The long version, for systems programmers: Watching a ROS 2 topic changes it, the observer-effect measurement and the symbol-interposition trick that avoids it.
Why
The question in production is simple: is every topic flowing at the rate it should, and which nodes are alive? The existing tools each fall short of answering it.
-
ros2 topic hzandros2 topic echosubscribe to one topic at a time. Watching a single 100 KB topic costs 7 % of a core withhzand 31 % withecho, they cannot see intra-process messages at all, and pointinghzat an intra-process topic makes the publisher start serializing every message, which raised the watched process’s CPU by 52 % in our measurements. - Built-in topic statistics are
bypassed by intra-process comms on Humble-class
binaries, so composable nodes carrying point clouds lose all introspection. This is fixed on
rollingand newer by rclcpp#3130 (merged April 2026); there is no public Humble backport as of this writing. -
ros2_tracing/ LTTng is built for offline analysis: a session daemon plus post-processing of a CTF trace just to get a rate. On Humble it also needs ROS rebuilt with the lttng-ust backend (Jazzy and newer trace out of the box). - CARET (Tier IV) uses the same hook layer as this probe, LD_PRELOAD over tracetools, which is a useful independent validation of the mechanism. It is built for deep offline latency and chain analysis and needs LTTng, a forked rclcpp and Jupyter post-processing. Complementary, not always-on.
- eBPF uprobes need
CAP_SYS_ADMIN, debugfs and a kernel with BTF and uprobes, which is often a non-starter on Jetson and other embedded targets, and they pay a kernel trap per message.
ros2_pulse hooks the tracetools instrumentation layer that rclcpp already calls on every
publish and every callback, counts in-process with a lock-free hot path, and writes ready-to-read
Hz to a small rolling file.
What you get
# ts_ns=1782887153899445923 window_s=5.000
TOPIC /scan 20.000000                      # publish-side, inter-process
PUB   /points inter=0.000000 intra=30.000000   # publish-side incl. intra (Iron+)
RECV  /scan inter=20.000000 intra=0.000000 # receive-side, BOTH transports
RECV  /points inter=0.000000 intra=30.000000   # <- intra-process, invisible to other tools on Humble
JITTER /scan recv max_dt_ms=21.284             # largest inter-arrival gap (opt-in, see below)
NODE  /perception
NODE  /planner
WARN  TOPIC /scan hz=1.200000 expected=[18,22]  # only with an expected-rate spec (see below)
If a sidecar exporter or a log shipper is reading instead of a person, ROS_TOPIC_STATS_FORMAT=jsonl
writes every window as one JSON object per line with the same gates and values. See
JSON Lines output. Dashboards that already
read rclcpp’s built-in topic statistics get the same numbers on /statistics from the
pulse_bridge sidecar, and Prometheus, OTLP and
Grafana get them from pulse-export.
How it works
libros2_pulse.so is injected with LD_PRELOAD. It exports the same symbols as
libtracetools.so’s tracepoint API (ros_trace_rcl_publish, ros_trace_callback_start, the
init tracepoints and so on). The dynamic linker binds rclcpp’s calls to ours first; each
interposer records a stat and forwards to the real function through dlsym(RTLD_NEXT, ...).
rclcpp calls these functions unconditionally (the LTTng enable check is inside them), so the
probe works with no tracing session and adds no DDS traffic.
- Intra-process visibility comes from
callback_start(callback, is_intra_process), which fires for every subscription callback regardless of transport. - The hot path is a per-endpoint relaxed atomic increment behind a 256-slot thread-local cache with a stride-breaking hash. No global lock, no per-message string hashing. Counting costs about 0.3 ns/op on a fixed endpoint and 0.6 to 1.2 ns/op alternating across a working set on the reference box, two orders of magnitude under a single LTTng-UST tracepoint (about 158 ns).
- A background timer snapshots and resets the counts every
ROS_TOPIC_STATISTICS_PUBLISH_PERIODseconds and appends the rates toROS_TOPIC_STATS_OUTPUT_FILE.
The pure C++ core (core/) has no ROS dependency and is unit tested on its own; the probe layer
(probe/) is a thin LD_PRELOAD shim.
Install
apt
File truncated at 100 lines see the full file
CONTRIBUTING
Contributing to ros2_pulse
Thanks for your interest. This is a small, focused package; contributions that keep it small and focused are the most welcome.
Ground rules
-
The core stays pure.
include/ros2_pulse/core/andsrc/core/must not depend on ROS, rclcpp, or tracetools. All ROS/tracetools coupling lives insrc/probe/. This is what keeps the logic unit-testable in isolation. -
The hot path stays cheap.
onPublish/onCallbackStartrun per message. No allocations, no string hashing, no global locks, per-endpoint atomics + the thread-local cache only. - No DDS traffic, no privileges. The probe writes a local file and opens no sockets. Keep it that way.
Dev workflow
# unit tests (pure core, no ROS): the fastest loop
GT=/opt/ros/humble/src/gtest_vendor
g++ -O2 -std=c++17 -pthread -Iinclude -I$GT/include -I$GT \
  test/unit/test_topic_registry.cpp src/core/topic_registry.cpp $GT/src/gtest-all.cc -o /tmp/ut && /tmp/ut

# full suite (unit + integration)
colcon build --packages-select ros2_pulse
colcon test --packages-select ros2_pulse && colcon test-result --verbose

# benchmark / overhead (see bench/README.md)
Pull requests
- Add or update tests for any behavior change (
test/unitfor core,test/integrationfor the probe end-to-end). - Run
colcon testand include the result in the PR. - For performance-affecting changes, run
bench/run_overhead_repeated.shand paste the numbers. - Keep commits conventional (
feat:,fix:,perf:,docs:,test:).
Reporting bugs
Open an issue with: ROS distro, RMW (FastRTPS/CycloneDDS), whether intra-process comms are on, the
relevant pulse.log window, and nm -D libtracetools.so | grep -c ros_trace output.
Repository Summary
| Checkout URI | https://github.com/TanayK07/ros2_pulse.git |
| VCS Type | git |
| VCS Version | main |
| Last Updated | 2026-10-02 |
| Dev Status | DEVELOPED |
| Released | RELEASED |
| Contributing |
Help Wanted (-)
Good First Issues (-) Pull Requests to Review (-) |
Packages
| Name | Version |
|---|---|
| ros2_pulse | 0.5.0 |
README
ros2_pulse
The heartbeat of your ROS 2 graph. A low-overhead probe that measures per-topic message rate and active-node liveness for both inter-process and intra-process traffic, on stock ROS 2 binaries, with no rebuild, no privileges and no network traffic. The counting hot path costs under a nanosecond per message; the whole probe costs about 2 % of workload CPU on a harsh 4,900 msg/s stress and less on real graphs.
pulse-top --demo: the probe’s log, live. Sparklines per topic, intra-process rates, structured warnings with ages. Install: pip3 install ros2-pulse-top (details).
Forty seconds on what watching a topic costs and what the probe does instead. Watch the video (40 s, YouTube) or read the docs.
The long version, for systems programmers: Watching a ROS 2 topic changes it, the observer-effect measurement and the symbol-interposition trick that avoids it.
Why
The question in production is simple: is every topic flowing at the rate it should, and which nodes are alive? The existing tools each fall short of answering it.
-
ros2 topic hzandros2 topic echosubscribe to one topic at a time. Watching a single 100 KB topic costs 7 % of a core withhzand 31 % withecho, they cannot see intra-process messages at all, and pointinghzat an intra-process topic makes the publisher start serializing every message, which raised the watched process’s CPU by 52 % in our measurements. - Built-in topic statistics are
bypassed by intra-process comms on Humble-class
binaries, so composable nodes carrying point clouds lose all introspection. This is fixed on
rollingand newer by rclcpp#3130 (merged April 2026); there is no public Humble backport as of this writing. -
ros2_tracing/ LTTng is built for offline analysis: a session daemon plus post-processing of a CTF trace just to get a rate. On Humble it also needs ROS rebuilt with the lttng-ust backend (Jazzy and newer trace out of the box). - CARET (Tier IV) uses the same hook layer as this probe, LD_PRELOAD over tracetools, which is a useful independent validation of the mechanism. It is built for deep offline latency and chain analysis and needs LTTng, a forked rclcpp and Jupyter post-processing. Complementary, not always-on.
- eBPF uprobes need
CAP_SYS_ADMIN, debugfs and a kernel with BTF and uprobes, which is often a non-starter on Jetson and other embedded targets, and they pay a kernel trap per message.
ros2_pulse hooks the tracetools instrumentation layer that rclcpp already calls on every
publish and every callback, counts in-process with a lock-free hot path, and writes ready-to-read
Hz to a small rolling file.
What you get
# ts_ns=1782887153899445923 window_s=5.000
TOPIC /scan 20.000000                      # publish-side, inter-process
PUB   /points inter=0.000000 intra=30.000000   # publish-side incl. intra (Iron+)
RECV  /scan inter=20.000000 intra=0.000000 # receive-side, BOTH transports
RECV  /points inter=0.000000 intra=30.000000   # <- intra-process, invisible to other tools on Humble
JITTER /scan recv max_dt_ms=21.284             # largest inter-arrival gap (opt-in, see below)
NODE  /perception
NODE  /planner
WARN  TOPIC /scan hz=1.200000 expected=[18,22]  # only with an expected-rate spec (see below)
If a sidecar exporter or a log shipper is reading instead of a person, ROS_TOPIC_STATS_FORMAT=jsonl
writes every window as one JSON object per line with the same gates and values. See
JSON Lines output. Dashboards that already
read rclcpp’s built-in topic statistics get the same numbers on /statistics from the
pulse_bridge sidecar, and Prometheus, OTLP and
Grafana get them from pulse-export.
How it works
libros2_pulse.so is injected with LD_PRELOAD. It exports the same symbols as
libtracetools.so’s tracepoint API (ros_trace_rcl_publish, ros_trace_callback_start, the
init tracepoints and so on). The dynamic linker binds rclcpp’s calls to ours first; each
interposer records a stat and forwards to the real function through dlsym(RTLD_NEXT, ...).
rclcpp calls these functions unconditionally (the LTTng enable check is inside them), so the
probe works with no tracing session and adds no DDS traffic.
- Intra-process visibility comes from
callback_start(callback, is_intra_process), which fires for every subscription callback regardless of transport. - The hot path is a per-endpoint relaxed atomic increment behind a 256-slot thread-local cache with a stride-breaking hash. No global lock, no per-message string hashing. Counting costs about 0.3 ns/op on a fixed endpoint and 0.6 to 1.2 ns/op alternating across a working set on the reference box, two orders of magnitude under a single LTTng-UST tracepoint (about 158 ns).
- A background timer snapshots and resets the counts every
ROS_TOPIC_STATISTICS_PUBLISH_PERIODseconds and appends the rates toROS_TOPIC_STATS_OUTPUT_FILE.
The pure C++ core (core/) has no ROS dependency and is unit tested on its own; the probe layer
(probe/) is a thin LD_PRELOAD shim.
Install
apt
File truncated at 100 lines see the full file
CONTRIBUTING
Contributing to ros2_pulse
Thanks for your interest. This is a small, focused package; contributions that keep it small and focused are the most welcome.
Ground rules
-
The core stays pure.
include/ros2_pulse/core/andsrc/core/must not depend on ROS, rclcpp, or tracetools. All ROS/tracetools coupling lives insrc/probe/. This is what keeps the logic unit-testable in isolation. -
The hot path stays cheap.
onPublish/onCallbackStartrun per message. No allocations, no string hashing, no global locks, per-endpoint atomics + the thread-local cache only. - No DDS traffic, no privileges. The probe writes a local file and opens no sockets. Keep it that way.
Dev workflow
# unit tests (pure core, no ROS): the fastest loop
GT=/opt/ros/humble/src/gtest_vendor
g++ -O2 -std=c++17 -pthread -Iinclude -I$GT/include -I$GT \
  test/unit/test_topic_registry.cpp src/core/topic_registry.cpp $GT/src/gtest-all.cc -o /tmp/ut && /tmp/ut

# full suite (unit + integration)
colcon build --packages-select ros2_pulse
colcon test --packages-select ros2_pulse && colcon test-result --verbose

# benchmark / overhead (see bench/README.md)
Pull requests
- Add or update tests for any behavior change (
test/unitfor core,test/integrationfor the probe end-to-end). - Run
colcon testand include the result in the PR. - For performance-affecting changes, run
bench/run_overhead_repeated.shand paste the numbers. - Keep commits conventional (
feat:,fix:,perf:,docs:,test:).
Reporting bugs
Open an issue with: ROS distro, RMW (FastRTPS/CycloneDDS), whether intra-process comms are on, the
relevant pulse.log window, and nm -D libtracetools.so | grep -c ros_trace output.
Repository Summary
| Checkout URI | https://github.com/TanayK07/ros2_pulse.git |
| VCS Type | git |
| VCS Version | main |
| Last Updated | 2026-10-02 |
| Dev Status | DEVELOPED |
| Released | RELEASED |
| Contributing |
Help Wanted (-)
Good First Issues (-) Pull Requests to Review (-) |
Packages
| Name | Version |
|---|---|
| ros2_pulse | 0.5.0 |
README
ros2_pulse
The heartbeat of your ROS 2 graph. A low-overhead probe that measures per-topic message rate and active-node liveness for both inter-process and intra-process traffic, on stock ROS 2 binaries, with no rebuild, no privileges and no network traffic. The counting hot path costs under a nanosecond per message; the whole probe costs about 2 % of workload CPU on a harsh 4,900 msg/s stress and less on real graphs.
pulse-top --demo: the probe’s log, live. Sparklines per topic, intra-process rates, structured warnings with ages. Install: pip3 install ros2-pulse-top (details).
Forty seconds on what watching a topic costs and what the probe does instead. Watch the video (40 s, YouTube) or read the docs.
The long version, for systems programmers: Watching a ROS 2 topic changes it, the observer-effect measurement and the symbol-interposition trick that avoids it.
Why
The question in production is simple: is every topic flowing at the rate it should, and which nodes are alive? The existing tools each fall short of answering it.
-
ros2 topic hzandros2 topic echosubscribe to one topic at a time. Watching a single 100 KB topic costs 7 % of a core withhzand 31 % withecho, they cannot see intra-process messages at all, and pointinghzat an intra-process topic makes the publisher start serializing every message, which raised the watched process’s CPU by 52 % in our measurements. - Built-in topic statistics are
bypassed by intra-process comms on Humble-class
binaries, so composable nodes carrying point clouds lose all introspection. This is fixed on
rollingand newer by rclcpp#3130 (merged April 2026); there is no public Humble backport as of this writing. -
ros2_tracing/ LTTng is built for offline analysis: a session daemon plus post-processing of a CTF trace just to get a rate. On Humble it also needs ROS rebuilt with the lttng-ust backend (Jazzy and newer trace out of the box). - CARET (Tier IV) uses the same hook layer as this probe, LD_PRELOAD over tracetools, which is a useful independent validation of the mechanism. It is built for deep offline latency and chain analysis and needs LTTng, a forked rclcpp and Jupyter post-processing. Complementary, not always-on.
- eBPF uprobes need
CAP_SYS_ADMIN, debugfs and a kernel with BTF and uprobes, which is often a non-starter on Jetson and other embedded targets, and they pay a kernel trap per message.
ros2_pulse hooks the tracetools instrumentation layer that rclcpp already calls on every
publish and every callback, counts in-process with a lock-free hot path, and writes ready-to-read
Hz to a small rolling file.
What you get
# ts_ns=1782887153899445923 window_s=5.000
TOPIC /scan 20.000000                      # publish-side, inter-process
PUB   /points inter=0.000000 intra=30.000000   # publish-side incl. intra (Iron+)
RECV  /scan inter=20.000000 intra=0.000000 # receive-side, BOTH transports
RECV  /points inter=0.000000 intra=30.000000   # <- intra-process, invisible to other tools on Humble
JITTER /scan recv max_dt_ms=21.284             # largest inter-arrival gap (opt-in, see below)
NODE  /perception
NODE  /planner
WARN  TOPIC /scan hz=1.200000 expected=[18,22]  # only with an expected-rate spec (see below)
If a sidecar exporter or a log shipper is reading instead of a person, ROS_TOPIC_STATS_FORMAT=jsonl
writes every window as one JSON object per line with the same gates and values. See
JSON Lines output. Dashboards that already
read rclcpp’s built-in topic statistics get the same numbers on /statistics from the
pulse_bridge sidecar, and Prometheus, OTLP and
Grafana get them from pulse-export.
How it works
libros2_pulse.so is injected with LD_PRELOAD. It exports the same symbols as
libtracetools.so’s tracepoint API (ros_trace_rcl_publish, ros_trace_callback_start, the
init tracepoints and so on). The dynamic linker binds rclcpp’s calls to ours first; each
interposer records a stat and forwards to the real function through dlsym(RTLD_NEXT, ...).
rclcpp calls these functions unconditionally (the LTTng enable check is inside them), so the
probe works with no tracing session and adds no DDS traffic.
- Intra-process visibility comes from
callback_start(callback, is_intra_process), which fires for every subscription callback regardless of transport. - The hot path is a per-endpoint relaxed atomic increment behind a 256-slot thread-local cache with a stride-breaking hash. No global lock, no per-message string hashing. Counting costs about 0.3 ns/op on a fixed endpoint and 0.6 to 1.2 ns/op alternating across a working set on the reference box, two orders of magnitude under a single LTTng-UST tracepoint (about 158 ns).
- A background timer snapshots and resets the counts every
ROS_TOPIC_STATISTICS_PUBLISH_PERIODseconds and appends the rates toROS_TOPIC_STATS_OUTPUT_FILE.
The pure C++ core (core/) has no ROS dependency and is unit tested on its own; the probe layer
(probe/) is a thin LD_PRELOAD shim.
Install
apt
File truncated at 100 lines see the full file
CONTRIBUTING
Contributing to ros2_pulse
Thanks for your interest. This is a small, focused package; contributions that keep it small and focused are the most welcome.
Ground rules
-
The core stays pure.
include/ros2_pulse/core/andsrc/core/must not depend on ROS, rclcpp, or tracetools. All ROS/tracetools coupling lives insrc/probe/. This is what keeps the logic unit-testable in isolation. -
The hot path stays cheap.
onPublish/onCallbackStartrun per message. No allocations, no string hashing, no global locks, per-endpoint atomics + the thread-local cache only. - No DDS traffic, no privileges. The probe writes a local file and opens no sockets. Keep it that way.
Dev workflow
# unit tests (pure core, no ROS): the fastest loop
GT=/opt/ros/humble/src/gtest_vendor
g++ -O2 -std=c++17 -pthread -Iinclude -I$GT/include -I$GT \
  test/unit/test_topic_registry.cpp src/core/topic_registry.cpp $GT/src/gtest-all.cc -o /tmp/ut && /tmp/ut

# full suite (unit + integration)
colcon build --packages-select ros2_pulse
colcon test --packages-select ros2_pulse && colcon test-result --verbose

# benchmark / overhead (see bench/README.md)
Pull requests
- Add or update tests for any behavior change (
test/unitfor core,test/integrationfor the probe end-to-end). - Run
colcon testand include the result in the PR. - For performance-affecting changes, run
bench/run_overhead_repeated.shand paste the numbers. - Keep commits conventional (
feat:,fix:,perf:,docs:,test:).
Reporting bugs
Open an issue with: ROS distro, RMW (FastRTPS/CycloneDDS), whether intra-process comms are on, the
relevant pulse.log window, and nm -D libtracetools.so | grep -c ros_trace output.
Repository Summary
| Checkout URI | https://github.com/TanayK07/ros2_pulse.git |
| VCS Type | git |
| VCS Version | main |
| Last Updated | 2026-10-02 |
| Dev Status | DEVELOPED |
| Released | RELEASED |
| Contributing |
Help Wanted (-)
Good First Issues (-) Pull Requests to Review (-) |
Packages
| Name | Version |
|---|---|
| ros2_pulse | 0.5.0 |
README
ros2_pulse
The heartbeat of your ROS 2 graph. A low-overhead probe that measures per-topic message rate and active-node liveness for both inter-process and intra-process traffic, on stock ROS 2 binaries, with no rebuild, no privileges and no network traffic. The counting hot path costs under a nanosecond per message; the whole probe costs about 2 % of workload CPU on a harsh 4,900 msg/s stress and less on real graphs.
pulse-top --demo: the probe’s log, live. Sparklines per topic, intra-process rates, structured warnings with ages. Install: pip3 install ros2-pulse-top (details).
Forty seconds on what watching a topic costs and what the probe does instead. Watch the video (40 s, YouTube) or read the docs.
The long version, for systems programmers: Watching a ROS 2 topic changes it, the observer-effect measurement and the symbol-interposition trick that avoids it.
Why
The question in production is simple: is every topic flowing at the rate it should, and which nodes are alive? The existing tools each fall short of answering it.
-
ros2 topic hzandros2 topic echosubscribe to one topic at a time. Watching a single 100 KB topic costs 7 % of a core withhzand 31 % withecho, they cannot see intra-process messages at all, and pointinghzat an intra-process topic makes the publisher start serializing every message, which raised the watched process’s CPU by 52 % in our measurements. - Built-in topic statistics are
bypassed by intra-process comms on Humble-class
binaries, so composable nodes carrying point clouds lose all introspection. This is fixed on
rollingand newer by rclcpp#3130 (merged April 2026); there is no public Humble backport as of this writing. -
ros2_tracing/ LTTng is built for offline analysis: a session daemon plus post-processing of a CTF trace just to get a rate. On Humble it also needs ROS rebuilt with the lttng-ust backend (Jazzy and newer trace out of the box). - CARET (Tier IV) uses the same hook layer as this probe, LD_PRELOAD over tracetools, which is a useful independent validation of the mechanism. It is built for deep offline latency and chain analysis and needs LTTng, a forked rclcpp and Jupyter post-processing. Complementary, not always-on.
- eBPF uprobes need
CAP_SYS_ADMIN, debugfs and a kernel with BTF and uprobes, which is often a non-starter on Jetson and other embedded targets, and they pay a kernel trap per message.
ros2_pulse hooks the tracetools instrumentation layer that rclcpp already calls on every
publish and every callback, counts in-process with a lock-free hot path, and writes ready-to-read
Hz to a small rolling file.
What you get
# ts_ns=1782887153899445923 window_s=5.000
TOPIC /scan 20.000000                      # publish-side, inter-process
PUB   /points inter=0.000000 intra=30.000000   # publish-side incl. intra (Iron+)
RECV  /scan inter=20.000000 intra=0.000000 # receive-side, BOTH transports
RECV  /points inter=0.000000 intra=30.000000   # <- intra-process, invisible to other tools on Humble
JITTER /scan recv max_dt_ms=21.284             # largest inter-arrival gap (opt-in, see below)
NODE  /perception
NODE  /planner
WARN  TOPIC /scan hz=1.200000 expected=[18,22]  # only with an expected-rate spec (see below)
If a sidecar exporter or a log shipper is reading instead of a person, ROS_TOPIC_STATS_FORMAT=jsonl
writes every window as one JSON object per line with the same gates and values. See
JSON Lines output. Dashboards that already
read rclcpp’s built-in topic statistics get the same numbers on /statistics from the
pulse_bridge sidecar, and Prometheus, OTLP and
Grafana get them from pulse-export.
How it works
libros2_pulse.so is injected with LD_PRELOAD. It exports the same symbols as
libtracetools.so’s tracepoint API (ros_trace_rcl_publish, ros_trace_callback_start, the
init tracepoints and so on). The dynamic linker binds rclcpp’s calls to ours first; each
interposer records a stat and forwards to the real function through dlsym(RTLD_NEXT, ...).
rclcpp calls these functions unconditionally (the LTTng enable check is inside them), so the
probe works with no tracing session and adds no DDS traffic.
- Intra-process visibility comes from
callback_start(callback, is_intra_process), which fires for every subscription callback regardless of transport. - The hot path is a per-endpoint relaxed atomic increment behind a 256-slot thread-local cache with a stride-breaking hash. No global lock, no per-message string hashing. Counting costs about 0.3 ns/op on a fixed endpoint and 0.6 to 1.2 ns/op alternating across a working set on the reference box, two orders of magnitude under a single LTTng-UST tracepoint (about 158 ns).
- A background timer snapshots and resets the counts every
ROS_TOPIC_STATISTICS_PUBLISH_PERIODseconds and appends the rates toROS_TOPIC_STATS_OUTPUT_FILE.
The pure C++ core (core/) has no ROS dependency and is unit tested on its own; the probe layer
(probe/) is a thin LD_PRELOAD shim.
Install
apt
File truncated at 100 lines see the full file
CONTRIBUTING
Contributing to ros2_pulse
Thanks for your interest. This is a small, focused package; contributions that keep it small and focused are the most welcome.
Ground rules
-
The core stays pure.
include/ros2_pulse/core/andsrc/core/must not depend on ROS, rclcpp, or tracetools. All ROS/tracetools coupling lives insrc/probe/. This is what keeps the logic unit-testable in isolation. -
The hot path stays cheap.
onPublish/onCallbackStartrun per message. No allocations, no string hashing, no global locks, per-endpoint atomics + the thread-local cache only. - No DDS traffic, no privileges. The probe writes a local file and opens no sockets. Keep it that way.
Dev workflow
# unit tests (pure core, no ROS): the fastest loop
GT=/opt/ros/humble/src/gtest_vendor
g++ -O2 -std=c++17 -pthread -Iinclude -I$GT/include -I$GT \
  test/unit/test_topic_registry.cpp src/core/topic_registry.cpp $GT/src/gtest-all.cc -o /tmp/ut && /tmp/ut

# full suite (unit + integration)
colcon build --packages-select ros2_pulse
colcon test --packages-select ros2_pulse && colcon test-result --verbose

# benchmark / overhead (see bench/README.md)
Pull requests
- Add or update tests for any behavior change (
test/unitfor core,test/integrationfor the probe end-to-end). - Run
colcon testand include the result in the PR. - For performance-affecting changes, run
bench/run_overhead_repeated.shand paste the numbers. - Keep commits conventional (
feat:,fix:,perf:,docs:,test:).
Reporting bugs
Open an issue with: ROS distro, RMW (FastRTPS/CycloneDDS), whether intra-process comms are on, the
relevant pulse.log window, and nm -D libtracetools.so | grep -c ros_trace output.
Repository Summary
| Checkout URI | https://github.com/TanayK07/ros2_pulse.git |
| VCS Type | git |
| VCS Version | main |
| Last Updated | 2026-10-02 |
| Dev Status | DEVELOPED |
| Released | RELEASED |
| Contributing |
Help Wanted (-)
Good First Issues (-) Pull Requests to Review (-) |
Packages
| Name | Version |
|---|---|
| ros2_pulse | 0.5.0 |
README
ros2_pulse
The heartbeat of your ROS 2 graph. A low-overhead probe that measures per-topic message rate and active-node liveness for both inter-process and intra-process traffic, on stock ROS 2 binaries, with no rebuild, no privileges and no network traffic. The counting hot path costs under a nanosecond per message; the whole probe costs about 2 % of workload CPU on a harsh 4,900 msg/s stress and less on real graphs.
pulse-top --demo: the probe’s log, live. Sparklines per topic, intra-process rates, structured warnings with ages. Install: pip3 install ros2-pulse-top (details).
Forty seconds on what watching a topic costs and what the probe does instead. Watch the video (40 s, YouTube) or read the docs.
The long version, for systems programmers: Watching a ROS 2 topic changes it, the observer-effect measurement and the symbol-interposition trick that avoids it.
Why
The question in production is simple: is every topic flowing at the rate it should, and which nodes are alive? The existing tools each fall short of answering it.
-
ros2 topic hzandros2 topic echosubscribe to one topic at a time. Watching a single 100 KB topic costs 7 % of a core withhzand 31 % withecho, they cannot see intra-process messages at all, and pointinghzat an intra-process topic makes the publisher start serializing every message, which raised the watched process’s CPU by 52 % in our measurements. - Built-in topic statistics are
bypassed by intra-process comms on Humble-class
binaries, so composable nodes carrying point clouds lose all introspection. This is fixed on
rollingand newer by rclcpp#3130 (merged April 2026); there is no public Humble backport as of this writing. -
ros2_tracing/ LTTng is built for offline analysis: a session daemon plus post-processing of a CTF trace just to get a rate. On Humble it also needs ROS rebuilt with the lttng-ust backend (Jazzy and newer trace out of the box). - CARET (Tier IV) uses the same hook layer as this probe, LD_PRELOAD over tracetools, which is a useful independent validation of the mechanism. It is built for deep offline latency and chain analysis and needs LTTng, a forked rclcpp and Jupyter post-processing. Complementary, not always-on.
- eBPF uprobes need
CAP_SYS_ADMIN, debugfs and a kernel with BTF and uprobes, which is often a non-starter on Jetson and other embedded targets, and they pay a kernel trap per message.
ros2_pulse hooks the tracetools instrumentation layer that rclcpp already calls on every
publish and every callback, counts in-process with a lock-free hot path, and writes ready-to-read
Hz to a small rolling file.
What you get
# ts_ns=1782887153899445923 window_s=5.000
TOPIC /scan 20.000000                      # publish-side, inter-process
PUB   /points inter=0.000000 intra=30.000000   # publish-side incl. intra (Iron+)
RECV  /scan inter=20.000000 intra=0.000000 # receive-side, BOTH transports
RECV  /points inter=0.000000 intra=30.000000   # <- intra-process, invisible to other tools on Humble
JITTER /scan recv max_dt_ms=21.284             # largest inter-arrival gap (opt-in, see below)
NODE  /perception
NODE  /planner
WARN  TOPIC /scan hz=1.200000 expected=[18,22]  # only with an expected-rate spec (see below)
If a sidecar exporter or a log shipper is reading instead of a person, ROS_TOPIC_STATS_FORMAT=jsonl
writes every window as one JSON object per line with the same gates and values. See
JSON Lines output. Dashboards that already
read rclcpp’s built-in topic statistics get the same numbers on /statistics from the
pulse_bridge sidecar, and Prometheus, OTLP and
Grafana get them from pulse-export.
How it works
libros2_pulse.so is injected with LD_PRELOAD. It exports the same symbols as
libtracetools.so’s tracepoint API (ros_trace_rcl_publish, ros_trace_callback_start, the
init tracepoints and so on). The dynamic linker binds rclcpp’s calls to ours first; each
interposer records a stat and forwards to the real function through dlsym(RTLD_NEXT, ...).
rclcpp calls these functions unconditionally (the LTTng enable check is inside them), so the
probe works with no tracing session and adds no DDS traffic.
- Intra-process visibility comes from
callback_start(callback, is_intra_process), which fires for every subscription callback regardless of transport. - The hot path is a per-endpoint relaxed atomic increment behind a 256-slot thread-local cache with a stride-breaking hash. No global lock, no per-message string hashing. Counting costs about 0.3 ns/op on a fixed endpoint and 0.6 to 1.2 ns/op alternating across a working set on the reference box, two orders of magnitude under a single LTTng-UST tracepoint (about 158 ns).
- A background timer snapshots and resets the counts every
ROS_TOPIC_STATISTICS_PUBLISH_PERIODseconds and appends the rates toROS_TOPIC_STATS_OUTPUT_FILE.
The pure C++ core (core/) has no ROS dependency and is unit tested on its own; the probe layer
(probe/) is a thin LD_PRELOAD shim.
Install
apt
File truncated at 100 lines see the full file
CONTRIBUTING
Contributing to ros2_pulse
Thanks for your interest. This is a small, focused package; contributions that keep it small and focused are the most welcome.
Ground rules
-
The core stays pure.
include/ros2_pulse/core/andsrc/core/must not depend on ROS, rclcpp, or tracetools. All ROS/tracetools coupling lives insrc/probe/. This is what keeps the logic unit-testable in isolation. -
The hot path stays cheap.
onPublish/onCallbackStartrun per message. No allocations, no string hashing, no global locks, per-endpoint atomics + the thread-local cache only. - No DDS traffic, no privileges. The probe writes a local file and opens no sockets. Keep it that way.
Dev workflow
# unit tests (pure core, no ROS): the fastest loop
GT=/opt/ros/humble/src/gtest_vendor
g++ -O2 -std=c++17 -pthread -Iinclude -I$GT/include -I$GT \
  test/unit/test_topic_registry.cpp src/core/topic_registry.cpp $GT/src/gtest-all.cc -o /tmp/ut && /tmp/ut

# full suite (unit + integration)
colcon build --packages-select ros2_pulse
colcon test --packages-select ros2_pulse && colcon test-result --verbose

# benchmark / overhead (see bench/README.md)
Pull requests
- Add or update tests for any behavior change (
test/unitfor core,test/integrationfor the probe end-to-end). - Run
colcon testand include the result in the PR. - For performance-affecting changes, run
bench/run_overhead_repeated.shand paste the numbers. - Keep commits conventional (
feat:,fix:,perf:,docs:,test:).
Reporting bugs
Open an issue with: ROS distro, RMW (FastRTPS/CycloneDDS), whether intra-process comms are on, the
relevant pulse.log window, and nm -D libtracetools.so | grep -c ros_trace output.
Repository Summary
| Checkout URI | https://github.com/TanayK07/ros2_pulse.git |
| VCS Type | git |
| VCS Version | main |
| Last Updated | 2026-10-02 |
| Dev Status | DEVELOPED |
| Released | RELEASED |
| Contributing |
Help Wanted (-)
Good First Issues (-) Pull Requests to Review (-) |
Packages
| Name | Version |
|---|---|
| ros2_pulse | 0.5.0 |
README
ros2_pulse
The heartbeat of your ROS 2 graph. A low-overhead probe that measures per-topic message rate and active-node liveness for both inter-process and intra-process traffic, on stock ROS 2 binaries, with no rebuild, no privileges and no network traffic. The counting hot path costs under a nanosecond per message; the whole probe costs about 2 % of workload CPU on a harsh 4,900 msg/s stress and less on real graphs.
pulse-top --demo: the probe’s log, live. Sparklines per topic, intra-process rates, structured warnings with ages. Install: pip3 install ros2-pulse-top (details).
Forty seconds on what watching a topic costs and what the probe does instead. Watch the video (40 s, YouTube) or read the docs.
The long version, for systems programmers: Watching a ROS 2 topic changes it, the observer-effect measurement and the symbol-interposition trick that avoids it.
Why
The question in production is simple: is every topic flowing at the rate it should, and which nodes are alive? The existing tools each fall short of answering it.
-
ros2 topic hzandros2 topic echosubscribe to one topic at a time. Watching a single 100 KB topic costs 7 % of a core withhzand 31 % withecho, they cannot see intra-process messages at all, and pointinghzat an intra-process topic makes the publisher start serializing every message, which raised the watched process’s CPU by 52 % in our measurements. - Built-in topic statistics are
bypassed by intra-process comms on Humble-class
binaries, so composable nodes carrying point clouds lose all introspection. This is fixed on
rollingand newer by rclcpp#3130 (merged April 2026); there is no public Humble backport as of this writing. -
ros2_tracing/ LTTng is built for offline analysis: a session daemon plus post-processing of a CTF trace just to get a rate. On Humble it also needs ROS rebuilt with the lttng-ust backend (Jazzy and newer trace out of the box). - CARET (Tier IV) uses the same hook layer as this probe, LD_PRELOAD over tracetools, which is a useful independent validation of the mechanism. It is built for deep offline latency and chain analysis and needs LTTng, a forked rclcpp and Jupyter post-processing. Complementary, not always-on.
- eBPF uprobes need
CAP_SYS_ADMIN, debugfs and a kernel with BTF and uprobes, which is often a non-starter on Jetson and other embedded targets, and they pay a kernel trap per message.
ros2_pulse hooks the tracetools instrumentation layer that rclcpp already calls on every
publish and every callback, counts in-process with a lock-free hot path, and writes ready-to-read
Hz to a small rolling file.
What you get
# ts_ns=1782887153899445923 window_s=5.000
TOPIC /scan 20.000000                      # publish-side, inter-process
PUB   /points inter=0.000000 intra=30.000000   # publish-side incl. intra (Iron+)
RECV  /scan inter=20.000000 intra=0.000000 # receive-side, BOTH transports
RECV  /points inter=0.000000 intra=30.000000   # <- intra-process, invisible to other tools on Humble
JITTER /scan recv max_dt_ms=21.284             # largest inter-arrival gap (opt-in, see below)
NODE  /perception
NODE  /planner
WARN  TOPIC /scan hz=1.200000 expected=[18,22]  # only with an expected-rate spec (see below)
If a sidecar exporter or a log shipper is reading instead of a person, ROS_TOPIC_STATS_FORMAT=jsonl
writes every window as one JSON object per line with the same gates and values. See
JSON Lines output. Dashboards that already
read rclcpp’s built-in topic statistics get the same numbers on /statistics from the
pulse_bridge sidecar, and Prometheus, OTLP and
Grafana get them from pulse-export.
How it works
libros2_pulse.so is injected with LD_PRELOAD. It exports the same symbols as
libtracetools.so’s tracepoint API (ros_trace_rcl_publish, ros_trace_callback_start, the
init tracepoints and so on). The dynamic linker binds rclcpp’s calls to ours first; each
interposer records a stat and forwards to the real function through dlsym(RTLD_NEXT, ...).
rclcpp calls these functions unconditionally (the LTTng enable check is inside them), so the
probe works with no tracing session and adds no DDS traffic.
- Intra-process visibility comes from
callback_start(callback, is_intra_process), which fires for every subscription callback regardless of transport. - The hot path is a per-endpoint relaxed atomic increment behind a 256-slot thread-local cache with a stride-breaking hash. No global lock, no per-message string hashing. Counting costs about 0.3 ns/op on a fixed endpoint and 0.6 to 1.2 ns/op alternating across a working set on the reference box, two orders of magnitude under a single LTTng-UST tracepoint (about 158 ns).
- A background timer snapshots and resets the counts every
ROS_TOPIC_STATISTICS_PUBLISH_PERIODseconds and appends the rates toROS_TOPIC_STATS_OUTPUT_FILE.
The pure C++ core (core/) has no ROS dependency and is unit tested on its own; the probe layer
(probe/) is a thin LD_PRELOAD shim.
Install
apt
File truncated at 100 lines see the full file
CONTRIBUTING
Contributing to ros2_pulse
Thanks for your interest. This is a small, focused package; contributions that keep it small and focused are the most welcome.
Ground rules
-
The core stays pure.
include/ros2_pulse/core/andsrc/core/must not depend on ROS, rclcpp, or tracetools. All ROS/tracetools coupling lives insrc/probe/. This is what keeps the logic unit-testable in isolation. -
The hot path stays cheap.
onPublish/onCallbackStartrun per message. No allocations, no string hashing, no global locks, per-endpoint atomics + the thread-local cache only. - No DDS traffic, no privileges. The probe writes a local file and opens no sockets. Keep it that way.
Dev workflow
# unit tests (pure core, no ROS): the fastest loop
GT=/opt/ros/humble/src/gtest_vendor
g++ -O2 -std=c++17 -pthread -Iinclude -I$GT/include -I$GT \
  test/unit/test_topic_registry.cpp src/core/topic_registry.cpp $GT/src/gtest-all.cc -o /tmp/ut && /tmp/ut

# full suite (unit + integration)
colcon build --packages-select ros2_pulse
colcon test --packages-select ros2_pulse && colcon test-result --verbose

# benchmark / overhead (see bench/README.md)
Pull requests
- Add or update tests for any behavior change (
test/unitfor core,test/integrationfor the probe end-to-end). - Run
colcon testand include the result in the PR. - For performance-affecting changes, run
bench/run_overhead_repeated.shand paste the numbers. - Keep commits conventional (
feat:,fix:,perf:,docs:,test:).
Reporting bugs
Open an issue with: ROS distro, RMW (FastRTPS/CycloneDDS), whether intra-process comms are on, the
relevant pulse.log window, and nm -D libtracetools.so | grep -c ros_trace output.
Repository Summary
| Checkout URI | https://github.com/TanayK07/ros2_pulse.git |
| VCS Type | git |
| VCS Version | main |
| Last Updated | 2026-10-02 |
| Dev Status | DEVELOPED |
| Released | RELEASED |
| Contributing |
Help Wanted (-)
Good First Issues (-) Pull Requests to Review (-) |
Packages
| Name | Version |
|---|---|
| ros2_pulse | 0.5.0 |
README
ros2_pulse
The heartbeat of your ROS 2 graph. A low-overhead probe that measures per-topic message rate and active-node liveness for both inter-process and intra-process traffic, on stock ROS 2 binaries, with no rebuild, no privileges and no network traffic. The counting hot path costs under a nanosecond per message; the whole probe costs about 2 % of workload CPU on a harsh 4,900 msg/s stress and less on real graphs.
pulse-top --demo: the probe’s log, live. Sparklines per topic, intra-process rates, structured warnings with ages. Install: pip3 install ros2-pulse-top (details).
Forty seconds on what watching a topic costs and what the probe does instead. Watch the video (40 s, YouTube) or read the docs.
The long version, for systems programmers: Watching a ROS 2 topic changes it, the observer-effect measurement and the symbol-interposition trick that avoids it.
Why
The question in production is simple: is every topic flowing at the rate it should, and which nodes are alive? The existing tools each fall short of answering it.
-
ros2 topic hzandros2 topic echosubscribe to one topic at a time. Watching a single 100 KB topic costs 7 % of a core withhzand 31 % withecho, they cannot see intra-process messages at all, and pointinghzat an intra-process topic makes the publisher start serializing every message, which raised the watched process’s CPU by 52 % in our measurements. - Built-in topic statistics are
bypassed by intra-process comms on Humble-class
binaries, so composable nodes carrying point clouds lose all introspection. This is fixed on
rollingand newer by rclcpp#3130 (merged April 2026); there is no public Humble backport as of this writing. -
ros2_tracing/ LTTng is built for offline analysis: a session daemon plus post-processing of a CTF trace just to get a rate. On Humble it also needs ROS rebuilt with the lttng-ust backend (Jazzy and newer trace out of the box). - CARET (Tier IV) uses the same hook layer as this probe, LD_PRELOAD over tracetools, which is a useful independent validation of the mechanism. It is built for deep offline latency and chain analysis and needs LTTng, a forked rclcpp and Jupyter post-processing. Complementary, not always-on.
- eBPF uprobes need
CAP_SYS_ADMIN, debugfs and a kernel with BTF and uprobes, which is often a non-starter on Jetson and other embedded targets, and they pay a kernel trap per message.
ros2_pulse hooks the tracetools instrumentation layer that rclcpp already calls on every
publish and every callback, counts in-process with a lock-free hot path, and writes ready-to-read
Hz to a small rolling file.
What you get
# ts_ns=1782887153899445923 window_s=5.000
TOPIC /scan 20.000000                      # publish-side, inter-process
PUB   /points inter=0.000000 intra=30.000000   # publish-side incl. intra (Iron+)
RECV  /scan inter=20.000000 intra=0.000000 # receive-side, BOTH transports
RECV  /points inter=0.000000 intra=30.000000   # <- intra-process, invisible to other tools on Humble
JITTER /scan recv max_dt_ms=21.284             # largest inter-arrival gap (opt-in, see below)
NODE  /perception
NODE  /planner
WARN  TOPIC /scan hz=1.200000 expected=[18,22]  # only with an expected-rate spec (see below)
If a sidecar exporter or a log shipper is reading instead of a person, ROS_TOPIC_STATS_FORMAT=jsonl
writes every window as one JSON object per line with the same gates and values. See
JSON Lines output. Dashboards that already
read rclcpp’s built-in topic statistics get the same numbers on /statistics from the
pulse_bridge sidecar, and Prometheus, OTLP and
Grafana get them from pulse-export.
How it works
libros2_pulse.so is injected with LD_PRELOAD. It exports the same symbols as
libtracetools.so’s tracepoint API (ros_trace_rcl_publish, ros_trace_callback_start, the
init tracepoints and so on). The dynamic linker binds rclcpp’s calls to ours first; each
interposer records a stat and forwards to the real function through dlsym(RTLD_NEXT, ...).
rclcpp calls these functions unconditionally (the LTTng enable check is inside them), so the
probe works with no tracing session and adds no DDS traffic.
- Intra-process visibility comes from
callback_start(callback, is_intra_process), which fires for every subscription callback regardless of transport. - The hot path is a per-endpoint relaxed atomic increment behind a 256-slot thread-local cache with a stride-breaking hash. No global lock, no per-message string hashing. Counting costs about 0.3 ns/op on a fixed endpoint and 0.6 to 1.2 ns/op alternating across a working set on the reference box, two orders of magnitude under a single LTTng-UST tracepoint (about 158 ns).
- A background timer snapshots and resets the counts every
ROS_TOPIC_STATISTICS_PUBLISH_PERIODseconds and appends the rates toROS_TOPIC_STATS_OUTPUT_FILE.
The pure C++ core (core/) has no ROS dependency and is unit tested on its own; the probe layer
(probe/) is a thin LD_PRELOAD shim.
Install
apt
File truncated at 100 lines see the full file
CONTRIBUTING
Contributing to ros2_pulse
Thanks for your interest. This is a small, focused package; contributions that keep it small and focused are the most welcome.
Ground rules
-
The core stays pure.
include/ros2_pulse/core/andsrc/core/must not depend on ROS, rclcpp, or tracetools. All ROS/tracetools coupling lives insrc/probe/. This is what keeps the logic unit-testable in isolation. -
The hot path stays cheap.
onPublish/onCallbackStartrun per message. No allocations, no string hashing, no global locks, per-endpoint atomics + the thread-local cache only. - No DDS traffic, no privileges. The probe writes a local file and opens no sockets. Keep it that way.
Dev workflow
# unit tests (pure core, no ROS): the fastest loop
GT=/opt/ros/humble/src/gtest_vendor
g++ -O2 -std=c++17 -pthread -Iinclude -I$GT/include -I$GT \
  test/unit/test_topic_registry.cpp src/core/topic_registry.cpp $GT/src/gtest-all.cc -o /tmp/ut && /tmp/ut

# full suite (unit + integration)
colcon build --packages-select ros2_pulse
colcon test --packages-select ros2_pulse && colcon test-result --verbose

# benchmark / overhead (see bench/README.md)
Pull requests
- Add or update tests for any behavior change (
test/unitfor core,test/integrationfor the probe end-to-end). - Run
colcon testand include the result in the PR. - For performance-affecting changes, run
bench/run_overhead_repeated.shand paste the numbers. - Keep commits conventional (
feat:,fix:,perf:,docs:,test:).
Reporting bugs
Open an issue with: ROS distro, RMW (FastRTPS/CycloneDDS), whether intra-process comms are on, the
relevant pulse.log window, and nm -D libtracetools.so | grep -c ros_trace output.
Repository Summary
| Checkout URI | https://github.com/TanayK07/ros2_pulse.git |
| VCS Type | git |
| VCS Version | main |
| Last Updated | 2026-10-02 |
| Dev Status | DEVELOPED |
| Released | RELEASED |
| Contributing |
Help Wanted (-)
Good First Issues (-) Pull Requests to Review (-) |
Packages
| Name | Version |
|---|---|
| ros2_pulse | 0.5.0 |
README
ros2_pulse
The heartbeat of your ROS 2 graph. A low-overhead probe that measures per-topic message rate and active-node liveness for both inter-process and intra-process traffic, on stock ROS 2 binaries, with no rebuild, no privileges and no network traffic. The counting hot path costs under a nanosecond per message; the whole probe costs about 2 % of workload CPU on a harsh 4,900 msg/s stress and less on real graphs.
pulse-top --demo: the probe’s log, live. Sparklines per topic, intra-process rates, structured warnings with ages. Install: pip3 install ros2-pulse-top (details).
Forty seconds on what watching a topic costs and what the probe does instead. Watch the video (40 s, YouTube) or read the docs.
The long version, for systems programmers: Watching a ROS 2 topic changes it, the observer-effect measurement and the symbol-interposition trick that avoids it.
Why
The question in production is simple: is every topic flowing at the rate it should, and which nodes are alive? The existing tools each fall short of answering it.
-
ros2 topic hzandros2 topic echosubscribe to one topic at a time. Watching a single 100 KB topic costs 7 % of a core withhzand 31 % withecho, they cannot see intra-process messages at all, and pointinghzat an intra-process topic makes the publisher start serializing every message, which raised the watched process’s CPU by 52 % in our measurements. - Built-in topic statistics are
bypassed by intra-process comms on Humble-class
binaries, so composable nodes carrying point clouds lose all introspection. This is fixed on
rollingand newer by rclcpp#3130 (merged April 2026); there is no public Humble backport as of this writing. -
ros2_tracing/ LTTng is built for offline analysis: a session daemon plus post-processing of a CTF trace just to get a rate. On Humble it also needs ROS rebuilt with the lttng-ust backend (Jazzy and newer trace out of the box). - CARET (Tier IV) uses the same hook layer as this probe, LD_PRELOAD over tracetools, which is a useful independent validation of the mechanism. It is built for deep offline latency and chain analysis and needs LTTng, a forked rclcpp and Jupyter post-processing. Complementary, not always-on.
- eBPF uprobes need
CAP_SYS_ADMIN, debugfs and a kernel with BTF and uprobes, which is often a non-starter on Jetson and other embedded targets, and they pay a kernel trap per message.
ros2_pulse hooks the tracetools instrumentation layer that rclcpp already calls on every
publish and every callback, counts in-process with a lock-free hot path, and writes ready-to-read
Hz to a small rolling file.
What you get
# ts_ns=1782887153899445923 window_s=5.000
TOPIC /scan 20.000000                      # publish-side, inter-process
PUB   /points inter=0.000000 intra=30.000000   # publish-side incl. intra (Iron+)
RECV  /scan inter=20.000000 intra=0.000000 # receive-side, BOTH transports
RECV  /points inter=0.000000 intra=30.000000   # <- intra-process, invisible to other tools on Humble
JITTER /scan recv max_dt_ms=21.284             # largest inter-arrival gap (opt-in, see below)
NODE  /perception
NODE  /planner
WARN  TOPIC /scan hz=1.200000 expected=[18,22]  # only with an expected-rate spec (see below)
If a sidecar exporter or a log shipper is reading instead of a person, ROS_TOPIC_STATS_FORMAT=jsonl
writes every window as one JSON object per line with the same gates and values. See
JSON Lines output. Dashboards that already
read rclcpp’s built-in topic statistics get the same numbers on /statistics from the
pulse_bridge sidecar, and Prometheus, OTLP and
Grafana get them from pulse-export.
How it works
libros2_pulse.so is injected with LD_PRELOAD. It exports the same symbols as
libtracetools.so’s tracepoint API (ros_trace_rcl_publish, ros_trace_callback_start, the
init tracepoints and so on). The dynamic linker binds rclcpp’s calls to ours first; each
interposer records a stat and forwards to the real function through dlsym(RTLD_NEXT, ...).
rclcpp calls these functions unconditionally (the LTTng enable check is inside them), so the
probe works with no tracing session and adds no DDS traffic.
- Intra-process visibility comes from
callback_start(callback, is_intra_process), which fires for every subscription callback regardless of transport. - The hot path is a per-endpoint relaxed atomic increment behind a 256-slot thread-local cache with a stride-breaking hash. No global lock, no per-message string hashing. Counting costs about 0.3 ns/op on a fixed endpoint and 0.6 to 1.2 ns/op alternating across a working set on the reference box, two orders of magnitude under a single LTTng-UST tracepoint (about 158 ns).
- A background timer snapshots and resets the counts every
ROS_TOPIC_STATISTICS_PUBLISH_PERIODseconds and appends the rates toROS_TOPIC_STATS_OUTPUT_FILE.
The pure C++ core (core/) has no ROS dependency and is unit tested on its own; the probe layer
(probe/) is a thin LD_PRELOAD shim.
Install
apt
File truncated at 100 lines see the full file
CONTRIBUTING
Contributing to ros2_pulse
Thanks for your interest. This is a small, focused package; contributions that keep it small and focused are the most welcome.
Ground rules
-
The core stays pure.
include/ros2_pulse/core/andsrc/core/must not depend on ROS, rclcpp, or tracetools. All ROS/tracetools coupling lives insrc/probe/. This is what keeps the logic unit-testable in isolation. -
The hot path stays cheap.
onPublish/onCallbackStartrun per message. No allocations, no string hashing, no global locks, per-endpoint atomics + the thread-local cache only. - No DDS traffic, no privileges. The probe writes a local file and opens no sockets. Keep it that way.
Dev workflow
# unit tests (pure core, no ROS): the fastest loop
GT=/opt/ros/humble/src/gtest_vendor
g++ -O2 -std=c++17 -pthread -Iinclude -I$GT/include -I$GT \
  test/unit/test_topic_registry.cpp src/core/topic_registry.cpp $GT/src/gtest-all.cc -o /tmp/ut && /tmp/ut

# full suite (unit + integration)
colcon build --packages-select ros2_pulse
colcon test --packages-select ros2_pulse && colcon test-result --verbose

# benchmark / overhead (see bench/README.md)
Pull requests
- Add or update tests for any behavior change (
test/unitfor core,test/integrationfor the probe end-to-end). - Run
colcon testand include the result in the PR. - For performance-affecting changes, run
bench/run_overhead_repeated.shand paste the numbers. - Keep commits conventional (
feat:,fix:,perf:,docs:,test:).
Reporting bugs
Open an issue with: ROS distro, RMW (FastRTPS/CycloneDDS), whether intra-process comms are on, the
relevant pulse.log window, and nm -D libtracetools.so | grep -c ros_trace output.
Repository Summary
| Checkout URI | https://github.com/TanayK07/ros2_pulse.git |
| VCS Type | git |
| VCS Version | main |
| Last Updated | 2026-10-02 |
| Dev Status | DEVELOPED |
| Released | RELEASED |
| Contributing |
Help Wanted (-)
Good First Issues (-) Pull Requests to Review (-) |
Packages
| Name | Version |
|---|---|
| ros2_pulse | 0.5.0 |
README
ros2_pulse
The heartbeat of your ROS 2 graph. A low-overhead probe that measures per-topic message rate and active-node liveness for both inter-process and intra-process traffic, on stock ROS 2 binaries, with no rebuild, no privileges and no network traffic. The counting hot path costs under a nanosecond per message; the whole probe costs about 2 % of workload CPU on a harsh 4,900 msg/s stress and less on real graphs.
pulse-top --demo: the probe’s log, live. Sparklines per topic, intra-process rates, structured warnings with ages. Install: pip3 install ros2-pulse-top (details).
Forty seconds on what watching a topic costs and what the probe does instead. Watch the video (40 s, YouTube) or read the docs.
The long version, for systems programmers: Watching a ROS 2 topic changes it, the observer-effect measurement and the symbol-interposition trick that avoids it.
Why
The question in production is simple: is every topic flowing at the rate it should, and which nodes are alive? The existing tools each fall short of answering it.
-
ros2 topic hzandros2 topic echosubscribe to one topic at a time. Watching a single 100 KB topic costs 7 % of a core withhzand 31 % withecho, they cannot see intra-process messages at all, and pointinghzat an intra-process topic makes the publisher start serializing every message, which raised the watched process’s CPU by 52 % in our measurements. - Built-in topic statistics are
bypassed by intra-process comms on Humble-class
binaries, so composable nodes carrying point clouds lose all introspection. This is fixed on
rollingand newer by rclcpp#3130 (merged April 2026); there is no public Humble backport as of this writing. -
ros2_tracing/ LTTng is built for offline analysis: a session daemon plus post-processing of a CTF trace just to get a rate. On Humble it also needs ROS rebuilt with the lttng-ust backend (Jazzy and newer trace out of the box). - CARET (Tier IV) uses the same hook layer as this probe, LD_PRELOAD over tracetools, which is a useful independent validation of the mechanism. It is built for deep offline latency and chain analysis and needs LTTng, a forked rclcpp and Jupyter post-processing. Complementary, not always-on.
- eBPF uprobes need
CAP_SYS_ADMIN, debugfs and a kernel with BTF and uprobes, which is often a non-starter on Jetson and other embedded targets, and they pay a kernel trap per message.
ros2_pulse hooks the tracetools instrumentation layer that rclcpp already calls on every
publish and every callback, counts in-process with a lock-free hot path, and writes ready-to-read
Hz to a small rolling file.
What you get
# ts_ns=1782887153899445923 window_s=5.000
TOPIC /scan 20.000000                      # publish-side, inter-process
PUB   /points inter=0.000000 intra=30.000000   # publish-side incl. intra (Iron+)
RECV  /scan inter=20.000000 intra=0.000000 # receive-side, BOTH transports
RECV  /points inter=0.000000 intra=30.000000   # <- intra-process, invisible to other tools on Humble
JITTER /scan recv max_dt_ms=21.284             # largest inter-arrival gap (opt-in, see below)
NODE  /perception
NODE  /planner
WARN  TOPIC /scan hz=1.200000 expected=[18,22]  # only with an expected-rate spec (see below)
If a sidecar exporter or a log shipper is reading instead of a person, ROS_TOPIC_STATS_FORMAT=jsonl
writes every window as one JSON object per line with the same gates and values. See
JSON Lines output. Dashboards that already
read rclcpp’s built-in topic statistics get the same numbers on /statistics from the
pulse_bridge sidecar, and Prometheus, OTLP and
Grafana get them from pulse-export.
How it works
libros2_pulse.so is injected with LD_PRELOAD. It exports the same symbols as
libtracetools.so’s tracepoint API (ros_trace_rcl_publish, ros_trace_callback_start, the
init tracepoints and so on). The dynamic linker binds rclcpp’s calls to ours first; each
interposer records a stat and forwards to the real function through dlsym(RTLD_NEXT, ...).
rclcpp calls these functions unconditionally (the LTTng enable check is inside them), so the
probe works with no tracing session and adds no DDS traffic.
- Intra-process visibility comes from
callback_start(callback, is_intra_process), which fires for every subscription callback regardless of transport. - The hot path is a per-endpoint relaxed atomic increment behind a 256-slot thread-local cache with a stride-breaking hash. No global lock, no per-message string hashing. Counting costs about 0.3 ns/op on a fixed endpoint and 0.6 to 1.2 ns/op alternating across a working set on the reference box, two orders of magnitude under a single LTTng-UST tracepoint (about 158 ns).
- A background timer snapshots and resets the counts every
ROS_TOPIC_STATISTICS_PUBLISH_PERIODseconds and appends the rates toROS_TOPIC_STATS_OUTPUT_FILE.
The pure C++ core (core/) has no ROS dependency and is unit tested on its own; the probe layer
(probe/) is a thin LD_PRELOAD shim.
Install
apt
File truncated at 100 lines see the full file
CONTRIBUTING
Contributing to ros2_pulse
Thanks for your interest. This is a small, focused package; contributions that keep it small and focused are the most welcome.
Ground rules
-
The core stays pure.
include/ros2_pulse/core/andsrc/core/must not depend on ROS, rclcpp, or tracetools. All ROS/tracetools coupling lives insrc/probe/. This is what keeps the logic unit-testable in isolation. -
The hot path stays cheap.
onPublish/onCallbackStartrun per message. No allocations, no string hashing, no global locks, per-endpoint atomics + the thread-local cache only. - No DDS traffic, no privileges. The probe writes a local file and opens no sockets. Keep it that way.
Dev workflow
# unit tests (pure core, no ROS): the fastest loop
GT=/opt/ros/humble/src/gtest_vendor
g++ -O2 -std=c++17 -pthread -Iinclude -I$GT/include -I$GT \
  test/unit/test_topic_registry.cpp src/core/topic_registry.cpp $GT/src/gtest-all.cc -o /tmp/ut && /tmp/ut

# full suite (unit + integration)
colcon build --packages-select ros2_pulse
colcon test --packages-select ros2_pulse && colcon test-result --verbose

# benchmark / overhead (see bench/README.md)
Pull requests
- Add or update tests for any behavior change (
test/unitfor core,test/integrationfor the probe end-to-end). - Run
colcon testand include the result in the PR. - For performance-affecting changes, run
bench/run_overhead_repeated.shand paste the numbers. - Keep commits conventional (
feat:,fix:,perf:,docs:,test:).
Reporting bugs
Open an issue with: ROS distro, RMW (FastRTPS/CycloneDDS), whether intra-process comms are on, the
relevant pulse.log window, and nm -D libtracetools.so | grep -c ros_trace output.
Repository Summary
| Checkout URI | https://github.com/TanayK07/ros2_pulse.git |
| VCS Type | git |
| VCS Version | main |
| Last Updated | 2026-10-02 |
| Dev Status | DEVELOPED |
| Released | RELEASED |
| Contributing |
Help Wanted (-)
Good First Issues (-) Pull Requests to Review (-) |
Packages
| Name | Version |
|---|---|
| ros2_pulse | 0.5.0 |
README
ros2_pulse
The heartbeat of your ROS 2 graph. A low-overhead probe that measures per-topic message rate and active-node liveness for both inter-process and intra-process traffic, on stock ROS 2 binaries, with no rebuild, no privileges and no network traffic. The counting hot path costs under a nanosecond per message; the whole probe costs about 2 % of workload CPU on a harsh 4,900 msg/s stress and less on real graphs.
pulse-top --demo: the probe’s log, live. Sparklines per topic, intra-process rates, structured warnings with ages. Install: pip3 install ros2-pulse-top (details).
Forty seconds on what watching a topic costs and what the probe does instead. Watch the video (40 s, YouTube) or read the docs.
The long version, for systems programmers: Watching a ROS 2 topic changes it, the observer-effect measurement and the symbol-interposition trick that avoids it.
Why
The question in production is simple: is every topic flowing at the rate it should, and which nodes are alive? The existing tools each fall short of answering it.
-
ros2 topic hzandros2 topic echosubscribe to one topic at a time. Watching a single 100 KB topic costs 7 % of a core withhzand 31 % withecho, they cannot see intra-process messages at all, and pointinghzat an intra-process topic makes the publisher start serializing every message, which raised the watched process’s CPU by 52 % in our measurements. - Built-in topic statistics are
bypassed by intra-process comms on Humble-class
binaries, so composable nodes carrying point clouds lose all introspection. This is fixed on
rollingand newer by rclcpp#3130 (merged April 2026); there is no public Humble backport as of this writing. -
ros2_tracing/ LTTng is built for offline analysis: a session daemon plus post-processing of a CTF trace just to get a rate. On Humble it also needs ROS rebuilt with the lttng-ust backend (Jazzy and newer trace out of the box). - CARET (Tier IV) uses the same hook layer as this probe, LD_PRELOAD over tracetools, which is a useful independent validation of the mechanism. It is built for deep offline latency and chain analysis and needs LTTng, a forked rclcpp and Jupyter post-processing. Complementary, not always-on.
- eBPF uprobes need
CAP_SYS_ADMIN, debugfs and a kernel with BTF and uprobes, which is often a non-starter on Jetson and other embedded targets, and they pay a kernel trap per message.
ros2_pulse hooks the tracetools instrumentation layer that rclcpp already calls on every
publish and every callback, counts in-process with a lock-free hot path, and writes ready-to-read
Hz to a small rolling file.
What you get
# ts_ns=1782887153899445923 window_s=5.000
TOPIC /scan 20.000000                      # publish-side, inter-process
PUB   /points inter=0.000000 intra=30.000000   # publish-side incl. intra (Iron+)
RECV  /scan inter=20.000000 intra=0.000000 # receive-side, BOTH transports
RECV  /points inter=0.000000 intra=30.000000   # <- intra-process, invisible to other tools on Humble
JITTER /scan recv max_dt_ms=21.284             # largest inter-arrival gap (opt-in, see below)
NODE  /perception
NODE  /planner
WARN  TOPIC /scan hz=1.200000 expected=[18,22]  # only with an expected-rate spec (see below)
If a sidecar exporter or a log shipper is reading instead of a person, ROS_TOPIC_STATS_FORMAT=jsonl
writes every window as one JSON object per line with the same gates and values. See
JSON Lines output. Dashboards that already
read rclcpp’s built-in topic statistics get the same numbers on /statistics from the
pulse_bridge sidecar, and Prometheus, OTLP and
Grafana get them from pulse-export.
How it works
libros2_pulse.so is injected with LD_PRELOAD. It exports the same symbols as
libtracetools.so’s tracepoint API (ros_trace_rcl_publish, ros_trace_callback_start, the
init tracepoints and so on). The dynamic linker binds rclcpp’s calls to ours first; each
interposer records a stat and forwards to the real function through dlsym(RTLD_NEXT, ...).
rclcpp calls these functions unconditionally (the LTTng enable check is inside them), so the
probe works with no tracing session and adds no DDS traffic.
- Intra-process visibility comes from
callback_start(callback, is_intra_process), which fires for every subscription callback regardless of transport. - The hot path is a per-endpoint relaxed atomic increment behind a 256-slot thread-local cache with a stride-breaking hash. No global lock, no per-message string hashing. Counting costs about 0.3 ns/op on a fixed endpoint and 0.6 to 1.2 ns/op alternating across a working set on the reference box, two orders of magnitude under a single LTTng-UST tracepoint (about 158 ns).
- A background timer snapshots and resets the counts every
ROS_TOPIC_STATISTICS_PUBLISH_PERIODseconds and appends the rates toROS_TOPIC_STATS_OUTPUT_FILE.
The pure C++ core (core/) has no ROS dependency and is unit tested on its own; the probe layer
(probe/) is a thin LD_PRELOAD shim.
Install
apt
File truncated at 100 lines see the full file
CONTRIBUTING
Contributing to ros2_pulse
Thanks for your interest. This is a small, focused package; contributions that keep it small and focused are the most welcome.
Ground rules
-
The core stays pure.
include/ros2_pulse/core/andsrc/core/must not depend on ROS, rclcpp, or tracetools. All ROS/tracetools coupling lives insrc/probe/. This is what keeps the logic unit-testable in isolation. -
The hot path stays cheap.
onPublish/onCallbackStartrun per message. No allocations, no string hashing, no global locks, per-endpoint atomics + the thread-local cache only. - No DDS traffic, no privileges. The probe writes a local file and opens no sockets. Keep it that way.
Dev workflow
# unit tests (pure core, no ROS): the fastest loop
GT=/opt/ros/humble/src/gtest_vendor
g++ -O2 -std=c++17 -pthread -Iinclude -I$GT/include -I$GT \
  test/unit/test_topic_registry.cpp src/core/topic_registry.cpp $GT/src/gtest-all.cc -o /tmp/ut && /tmp/ut

# full suite (unit + integration)
colcon build --packages-select ros2_pulse
colcon test --packages-select ros2_pulse && colcon test-result --verbose

# benchmark / overhead (see bench/README.md)
Pull requests
- Add or update tests for any behavior change (
test/unitfor core,test/integrationfor the probe end-to-end). - Run
colcon testand include the result in the PR. - For performance-affecting changes, run
bench/run_overhead_repeated.shand paste the numbers. - Keep commits conventional (
feat:,fix:,perf:,docs:,test:).
Reporting bugs
Open an issue with: ROS distro, RMW (FastRTPS/CycloneDDS), whether intra-process comms are on, the
relevant pulse.log window, and nm -D libtracetools.so | grep -c ros_trace output.
Repository Summary
| Checkout URI | https://github.com/TanayK07/ros2_pulse.git |
| VCS Type | git |
| VCS Version | main |
| Last Updated | 2026-10-02 |
| Dev Status | DEVELOPED |
| Released | RELEASED |
| Contributing |
Help Wanted (-)
Good First Issues (-) Pull Requests to Review (-) |
Packages
| Name | Version |
|---|---|
| ros2_pulse | 0.5.0 |
README
ros2_pulse
The heartbeat of your ROS 2 graph. A low-overhead probe that measures per-topic message rate and active-node liveness for both inter-process and intra-process traffic, on stock ROS 2 binaries, with no rebuild, no privileges and no network traffic. The counting hot path costs under a nanosecond per message; the whole probe costs about 2 % of workload CPU on a harsh 4,900 msg/s stress and less on real graphs.
pulse-top --demo: the probe’s log, live. Sparklines per topic, intra-process rates, structured warnings with ages. Install: pip3 install ros2-pulse-top (details).
Forty seconds on what watching a topic costs and what the probe does instead. Watch the video (40 s, YouTube) or read the docs.
The long version, for systems programmers: Watching a ROS 2 topic changes it, the observer-effect measurement and the symbol-interposition trick that avoids it.
Why
The question in production is simple: is every topic flowing at the rate it should, and which nodes are alive? The existing tools each fall short of answering it.
-
ros2 topic hzandros2 topic echosubscribe to one topic at a time. Watching a single 100 KB topic costs 7 % of a core withhzand 31 % withecho, they cannot see intra-process messages at all, and pointinghzat an intra-process topic makes the publisher start serializing every message, which raised the watched process’s CPU by 52 % in our measurements. - Built-in topic statistics are
bypassed by intra-process comms on Humble-class
binaries, so composable nodes carrying point clouds lose all introspection. This is fixed on
rollingand newer by rclcpp#3130 (merged April 2026); there is no public Humble backport as of this writing. -
ros2_tracing/ LTTng is built for offline analysis: a session daemon plus post-processing of a CTF trace just to get a rate. On Humble it also needs ROS rebuilt with the lttng-ust backend (Jazzy and newer trace out of the box). - CARET (Tier IV) uses the same hook layer as this probe, LD_PRELOAD over tracetools, which is a useful independent validation of the mechanism. It is built for deep offline latency and chain analysis and needs LTTng, a forked rclcpp and Jupyter post-processing. Complementary, not always-on.
- eBPF uprobes need
CAP_SYS_ADMIN, debugfs and a kernel with BTF and uprobes, which is often a non-starter on Jetson and other embedded targets, and they pay a kernel trap per message.
ros2_pulse hooks the tracetools instrumentation layer that rclcpp already calls on every
publish and every callback, counts in-process with a lock-free hot path, and writes ready-to-read
Hz to a small rolling file.
What you get
# ts_ns=1782887153899445923 window_s=5.000
TOPIC /scan 20.000000                      # publish-side, inter-process
PUB   /points inter=0.000000 intra=30.000000   # publish-side incl. intra (Iron+)
RECV  /scan inter=20.000000 intra=0.000000 # receive-side, BOTH transports
RECV  /points inter=0.000000 intra=30.000000   # <- intra-process, invisible to other tools on Humble
JITTER /scan recv max_dt_ms=21.284             # largest inter-arrival gap (opt-in, see below)
NODE  /perception
NODE  /planner
WARN  TOPIC /scan hz=1.200000 expected=[18,22]  # only with an expected-rate spec (see below)
If a sidecar exporter or a log shipper is reading instead of a person, ROS_TOPIC_STATS_FORMAT=jsonl
writes every window as one JSON object per line with the same gates and values. See
JSON Lines output. Dashboards that already
read rclcpp’s built-in topic statistics get the same numbers on /statistics from the
pulse_bridge sidecar, and Prometheus, OTLP and
Grafana get them from pulse-export.
How it works
libros2_pulse.so is injected with LD_PRELOAD. It exports the same symbols as
libtracetools.so’s tracepoint API (ros_trace_rcl_publish, ros_trace_callback_start, the
init tracepoints and so on). The dynamic linker binds rclcpp’s calls to ours first; each
interposer records a stat and forwards to the real function through dlsym(RTLD_NEXT, ...).
rclcpp calls these functions unconditionally (the LTTng enable check is inside them), so the
probe works with no tracing session and adds no DDS traffic.
- Intra-process visibility comes from
callback_start(callback, is_intra_process), which fires for every subscription callback regardless of transport. - The hot path is a per-endpoint relaxed atomic increment behind a 256-slot thread-local cache with a stride-breaking hash. No global lock, no per-message string hashing. Counting costs about 0.3 ns/op on a fixed endpoint and 0.6 to 1.2 ns/op alternating across a working set on the reference box, two orders of magnitude under a single LTTng-UST tracepoint (about 158 ns).
- A background timer snapshots and resets the counts every
ROS_TOPIC_STATISTICS_PUBLISH_PERIODseconds and appends the rates toROS_TOPIC_STATS_OUTPUT_FILE.
The pure C++ core (core/) has no ROS dependency and is unit tested on its own; the probe layer
(probe/) is a thin LD_PRELOAD shim.
Install
apt
File truncated at 100 lines see the full file
CONTRIBUTING
Contributing to ros2_pulse
Thanks for your interest. This is a small, focused package; contributions that keep it small and focused are the most welcome.
Ground rules
-
The core stays pure.
include/ros2_pulse/core/andsrc/core/must not depend on ROS, rclcpp, or tracetools. All ROS/tracetools coupling lives insrc/probe/. This is what keeps the logic unit-testable in isolation. -
The hot path stays cheap.
onPublish/onCallbackStartrun per message. No allocations, no string hashing, no global locks, per-endpoint atomics + the thread-local cache only. - No DDS traffic, no privileges. The probe writes a local file and opens no sockets. Keep it that way.
Dev workflow
# unit tests (pure core, no ROS): the fastest loop
GT=/opt/ros/humble/src/gtest_vendor
g++ -O2 -std=c++17 -pthread -Iinclude -I$GT/include -I$GT \
  test/unit/test_topic_registry.cpp src/core/topic_registry.cpp $GT/src/gtest-all.cc -o /tmp/ut && /tmp/ut

# full suite (unit + integration)
colcon build --packages-select ros2_pulse
colcon test --packages-select ros2_pulse && colcon test-result --verbose

# benchmark / overhead (see bench/README.md)
Pull requests
- Add or update tests for any behavior change (
test/unitfor core,test/integrationfor the probe end-to-end). - Run
colcon testand include the result in the PR. - For performance-affecting changes, run
bench/run_overhead_repeated.shand paste the numbers. - Keep commits conventional (
feat:,fix:,perf:,docs:,test:).
Reporting bugs
Open an issue with: ROS distro, RMW (FastRTPS/CycloneDDS), whether intra-process comms are on, the
relevant pulse.log window, and nm -D libtracetools.so | grep -c ros_trace output.
Repository Summary
| Checkout URI | https://github.com/TanayK07/ros2_pulse.git |
| VCS Type | git |
| VCS Version | main |
| Last Updated | 2026-10-02 |
| Dev Status | DEVELOPED |
| Released | RELEASED |
| Contributing |
Help Wanted (-)
Good First Issues (-) Pull Requests to Review (-) |
Packages
| Name | Version |
|---|---|
| ros2_pulse | 0.5.0 |
README
ros2_pulse
The heartbeat of your ROS 2 graph. A low-overhead probe that measures per-topic message rate and active-node liveness for both inter-process and intra-process traffic, on stock ROS 2 binaries, with no rebuild, no privileges and no network traffic. The counting hot path costs under a nanosecond per message; the whole probe costs about 2 % of workload CPU on a harsh 4,900 msg/s stress and less on real graphs.
pulse-top --demo: the probe’s log, live. Sparklines per topic, intra-process rates, structured warnings with ages. Install: pip3 install ros2-pulse-top (details).
Forty seconds on what watching a topic costs and what the probe does instead. Watch the video (40 s, YouTube) or read the docs.
The long version, for systems programmers: Watching a ROS 2 topic changes it, the observer-effect measurement and the symbol-interposition trick that avoids it.
Why
The question in production is simple: is every topic flowing at the rate it should, and which nodes are alive? The existing tools each fall short of answering it.
-
ros2 topic hzandros2 topic echosubscribe to one topic at a time. Watching a single 100 KB topic costs 7 % of a core withhzand 31 % withecho, they cannot see intra-process messages at all, and pointinghzat an intra-process topic makes the publisher start serializing every message, which raised the watched process’s CPU by 52 % in our measurements. - Built-in topic statistics are
bypassed by intra-process comms on Humble-class
binaries, so composable nodes carrying point clouds lose all introspection. This is fixed on
rollingand newer by rclcpp#3130 (merged April 2026); there is no public Humble backport as of this writing. -
ros2_tracing/ LTTng is built for offline analysis: a session daemon plus post-processing of a CTF trace just to get a rate. On Humble it also needs ROS rebuilt with the lttng-ust backend (Jazzy and newer trace out of the box). - CARET (Tier IV) uses the same hook layer as this probe, LD_PRELOAD over tracetools, which is a useful independent validation of the mechanism. It is built for deep offline latency and chain analysis and needs LTTng, a forked rclcpp and Jupyter post-processing. Complementary, not always-on.
- eBPF uprobes need
CAP_SYS_ADMIN, debugfs and a kernel with BTF and uprobes, which is often a non-starter on Jetson and other embedded targets, and they pay a kernel trap per message.
ros2_pulse hooks the tracetools instrumentation layer that rclcpp already calls on every
publish and every callback, counts in-process with a lock-free hot path, and writes ready-to-read
Hz to a small rolling file.
What you get
# ts_ns=1782887153899445923 window_s=5.000
TOPIC /scan 20.000000                      # publish-side, inter-process
PUB   /points inter=0.000000 intra=30.000000   # publish-side incl. intra (Iron+)
RECV  /scan inter=20.000000 intra=0.000000 # receive-side, BOTH transports
RECV  /points inter=0.000000 intra=30.000000   # <- intra-process, invisible to other tools on Humble
JITTER /scan recv max_dt_ms=21.284             # largest inter-arrival gap (opt-in, see below)
NODE  /perception
NODE  /planner
WARN  TOPIC /scan hz=1.200000 expected=[18,22]  # only with an expected-rate spec (see below)
If a sidecar exporter or a log shipper is reading instead of a person, ROS_TOPIC_STATS_FORMAT=jsonl
writes every window as one JSON object per line with the same gates and values. See
JSON Lines output. Dashboards that already
read rclcpp’s built-in topic statistics get the same numbers on /statistics from the
pulse_bridge sidecar, and Prometheus, OTLP and
Grafana get them from pulse-export.
How it works
libros2_pulse.so is injected with LD_PRELOAD. It exports the same symbols as
libtracetools.so’s tracepoint API (ros_trace_rcl_publish, ros_trace_callback_start, the
init tracepoints and so on). The dynamic linker binds rclcpp’s calls to ours first; each
interposer records a stat and forwards to the real function through dlsym(RTLD_NEXT, ...).
rclcpp calls these functions unconditionally (the LTTng enable check is inside them), so the
probe works with no tracing session and adds no DDS traffic.
- Intra-process visibility comes from
callback_start(callback, is_intra_process), which fires for every subscription callback regardless of transport. - The hot path is a per-endpoint relaxed atomic increment behind a 256-slot thread-local cache with a stride-breaking hash. No global lock, no per-message string hashing. Counting costs about 0.3 ns/op on a fixed endpoint and 0.6 to 1.2 ns/op alternating across a working set on the reference box, two orders of magnitude under a single LTTng-UST tracepoint (about 158 ns).
- A background timer snapshots and resets the counts every
ROS_TOPIC_STATISTICS_PUBLISH_PERIODseconds and appends the rates toROS_TOPIC_STATS_OUTPUT_FILE.
The pure C++ core (core/) has no ROS dependency and is unit tested on its own; the probe layer
(probe/) is a thin LD_PRELOAD shim.
Install
apt
File truncated at 100 lines see the full file
CONTRIBUTING
Contributing to ros2_pulse
Thanks for your interest. This is a small, focused package; contributions that keep it small and focused are the most welcome.
Ground rules
-
The core stays pure.
include/ros2_pulse/core/andsrc/core/must not depend on ROS, rclcpp, or tracetools. All ROS/tracetools coupling lives insrc/probe/. This is what keeps the logic unit-testable in isolation. -
The hot path stays cheap.
onPublish/onCallbackStartrun per message. No allocations, no string hashing, no global locks, per-endpoint atomics + the thread-local cache only. - No DDS traffic, no privileges. The probe writes a local file and opens no sockets. Keep it that way.
Dev workflow
# unit tests (pure core, no ROS): the fastest loop
GT=/opt/ros/humble/src/gtest_vendor
g++ -O2 -std=c++17 -pthread -Iinclude -I$GT/include -I$GT \
  test/unit/test_topic_registry.cpp src/core/topic_registry.cpp $GT/src/gtest-all.cc -o /tmp/ut && /tmp/ut

# full suite (unit + integration)
colcon build --packages-select ros2_pulse
colcon test --packages-select ros2_pulse && colcon test-result --verbose

# benchmark / overhead (see bench/README.md)
Pull requests
- Add or update tests for any behavior change (
test/unitfor core,test/integrationfor the probe end-to-end). - Run
colcon testand include the result in the PR. - For performance-affecting changes, run
bench/run_overhead_repeated.shand paste the numbers. - Keep commits conventional (
feat:,fix:,perf:,docs:,test:).
Reporting bugs
Open an issue with: ROS distro, RMW (FastRTPS/CycloneDDS), whether intra-process comms are on, the
relevant pulse.log window, and nm -D libtracetools.so | grep -c ros_trace output.
Repository Summary
| Checkout URI | https://github.com/TanayK07/ros2_pulse.git |
| VCS Type | git |
| VCS Version | main |
| Last Updated | 2026-10-02 |
| Dev Status | DEVELOPED |
| Released | RELEASED |
| Contributing |
Help Wanted (-)
Good First Issues (-) Pull Requests to Review (-) |
Packages
| Name | Version |
|---|---|
| ros2_pulse | 0.5.0 |
README
ros2_pulse
The heartbeat of your ROS 2 graph. A low-overhead probe that measures per-topic message rate and active-node liveness for both inter-process and intra-process traffic, on stock ROS 2 binaries, with no rebuild, no privileges and no network traffic. The counting hot path costs under a nanosecond per message; the whole probe costs about 2 % of workload CPU on a harsh 4,900 msg/s stress and less on real graphs.
pulse-top --demo: the probe’s log, live. Sparklines per topic, intra-process rates, structured warnings with ages. Install: pip3 install ros2-pulse-top (details).
Forty seconds on what watching a topic costs and what the probe does instead. Watch the video (40 s, YouTube) or read the docs.
The long version, for systems programmers: Watching a ROS 2 topic changes it, the observer-effect measurement and the symbol-interposition trick that avoids it.
Why
The question in production is simple: is every topic flowing at the rate it should, and which nodes are alive? The existing tools each fall short of answering it.
-
ros2 topic hzandros2 topic echosubscribe to one topic at a time. Watching a single 100 KB topic costs 7 % of a core withhzand 31 % withecho, they cannot see intra-process messages at all, and pointinghzat an intra-process topic makes the publisher start serializing every message, which raised the watched process’s CPU by 52 % in our measurements. - Built-in topic statistics are
bypassed by intra-process comms on Humble-class
binaries, so composable nodes carrying point clouds lose all introspection. This is fixed on
rollingand newer by rclcpp#3130 (merged April 2026); there is no public Humble backport as of this writing. -
ros2_tracing/ LTTng is built for offline analysis: a session daemon plus post-processing of a CTF trace just to get a rate. On Humble it also needs ROS rebuilt with the lttng-ust backend (Jazzy and newer trace out of the box). - CARET (Tier IV) uses the same hook layer as this probe, LD_PRELOAD over tracetools, which is a useful independent validation of the mechanism. It is built for deep offline latency and chain analysis and needs LTTng, a forked rclcpp and Jupyter post-processing. Complementary, not always-on.
- eBPF uprobes need
CAP_SYS_ADMIN, debugfs and a kernel with BTF and uprobes, which is often a non-starter on Jetson and other embedded targets, and they pay a kernel trap per message.
ros2_pulse hooks the tracetools instrumentation layer that rclcpp already calls on every
publish and every callback, counts in-process with a lock-free hot path, and writes ready-to-read
Hz to a small rolling file.
What you get
# ts_ns=1782887153899445923 window_s=5.000
TOPIC /scan 20.000000                      # publish-side, inter-process
PUB   /points inter=0.000000 intra=30.000000   # publish-side incl. intra (Iron+)
RECV  /scan inter=20.000000 intra=0.000000 # receive-side, BOTH transports
RECV  /points inter=0.000000 intra=30.000000   # <- intra-process, invisible to other tools on Humble
JITTER /scan recv max_dt_ms=21.284             # largest inter-arrival gap (opt-in, see below)
NODE  /perception
NODE  /planner
WARN  TOPIC /scan hz=1.200000 expected=[18,22]  # only with an expected-rate spec (see below)
If a sidecar exporter or a log shipper is reading instead of a person, ROS_TOPIC_STATS_FORMAT=jsonl
writes every window as one JSON object per line with the same gates and values. See
JSON Lines output. Dashboards that already
read rclcpp’s built-in topic statistics get the same numbers on /statistics from the
pulse_bridge sidecar, and Prometheus, OTLP and
Grafana get them from pulse-export.
How it works
libros2_pulse.so is injected with LD_PRELOAD. It exports the same symbols as
libtracetools.so’s tracepoint API (ros_trace_rcl_publish, ros_trace_callback_start, the
init tracepoints and so on). The dynamic linker binds rclcpp’s calls to ours first; each
interposer records a stat and forwards to the real function through dlsym(RTLD_NEXT, ...).
rclcpp calls these functions unconditionally (the LTTng enable check is inside them), so the
probe works with no tracing session and adds no DDS traffic.
- Intra-process visibility comes from
callback_start(callback, is_intra_process), which fires for every subscription callback regardless of transport. - The hot path is a per-endpoint relaxed atomic increment behind a 256-slot thread-local cache with a stride-breaking hash. No global lock, no per-message string hashing. Counting costs about 0.3 ns/op on a fixed endpoint and 0.6 to 1.2 ns/op alternating across a working set on the reference box, two orders of magnitude under a single LTTng-UST tracepoint (about 158 ns).
- A background timer snapshots and resets the counts every
ROS_TOPIC_STATISTICS_PUBLISH_PERIODseconds and appends the rates toROS_TOPIC_STATS_OUTPUT_FILE.
The pure C++ core (core/) has no ROS dependency and is unit tested on its own; the probe layer
(probe/) is a thin LD_PRELOAD shim.
Install
apt
File truncated at 100 lines see the full file
CONTRIBUTING
Contributing to ros2_pulse
Thanks for your interest. This is a small, focused package; contributions that keep it small and focused are the most welcome.
Ground rules
-
The core stays pure.
include/ros2_pulse/core/andsrc/core/must not depend on ROS, rclcpp, or tracetools. All ROS/tracetools coupling lives insrc/probe/. This is what keeps the logic unit-testable in isolation. -
The hot path stays cheap.
onPublish/onCallbackStartrun per message. No allocations, no string hashing, no global locks, per-endpoint atomics + the thread-local cache only. - No DDS traffic, no privileges. The probe writes a local file and opens no sockets. Keep it that way.
Dev workflow
# unit tests (pure core, no ROS): the fastest loop
GT=/opt/ros/humble/src/gtest_vendor
g++ -O2 -std=c++17 -pthread -Iinclude -I$GT/include -I$GT \
  test/unit/test_topic_registry.cpp src/core/topic_registry.cpp $GT/src/gtest-all.cc -o /tmp/ut && /tmp/ut

# full suite (unit + integration)
colcon build --packages-select ros2_pulse
colcon test --packages-select ros2_pulse && colcon test-result --verbose

# benchmark / overhead (see bench/README.md)
Pull requests
- Add or update tests for any behavior change (
test/unitfor core,test/integrationfor the probe end-to-end). - Run
colcon testand include the result in the PR. - For performance-affecting changes, run
bench/run_overhead_repeated.shand paste the numbers. - Keep commits conventional (
feat:,fix:,perf:,docs:,test:).
Reporting bugs
Open an issue with: ROS distro, RMW (FastRTPS/CycloneDDS), whether intra-process comms are on, the
relevant pulse.log window, and nm -D libtracetools.so | grep -c ros_trace output.
Repository Summary
| Checkout URI | https://github.com/TanayK07/ros2_pulse.git |
| VCS Type | git |
| VCS Version | main |
| Last Updated | 2026-10-02 |
| Dev Status | DEVELOPED |
| Released | RELEASED |
| Contributing |
Help Wanted (-)
Good First Issues (-) Pull Requests to Review (-) |
Packages
| Name | Version |
|---|---|
| ros2_pulse | 0.5.0 |
README
ros2_pulse
The heartbeat of your ROS 2 graph. A low-overhead probe that measures per-topic message rate and active-node liveness for both inter-process and intra-process traffic, on stock ROS 2 binaries, with no rebuild, no privileges and no network traffic. The counting hot path costs under a nanosecond per message; the whole probe costs about 2 % of workload CPU on a harsh 4,900 msg/s stress and less on real graphs.
pulse-top --demo: the probe’s log, live. Sparklines per topic, intra-process rates, structured warnings with ages. Install: pip3 install ros2-pulse-top (details).
Forty seconds on what watching a topic costs and what the probe does instead. Watch the video (40 s, YouTube) or read the docs.
The long version, for systems programmers: Watching a ROS 2 topic changes it, the observer-effect measurement and the symbol-interposition trick that avoids it.
Why
The question in production is simple: is every topic flowing at the rate it should, and which nodes are alive? The existing tools each fall short of answering it.
-
ros2 topic hzandros2 topic echosubscribe to one topic at a time. Watching a single 100 KB topic costs 7 % of a core withhzand 31 % withecho, they cannot see intra-process messages at all, and pointinghzat an intra-process topic makes the publisher start serializing every message, which raised the watched process’s CPU by 52 % in our measurements. - Built-in topic statistics are
bypassed by intra-process comms on Humble-class
binaries, so composable nodes carrying point clouds lose all introspection. This is fixed on
rollingand newer by rclcpp#3130 (merged April 2026); there is no public Humble backport as of this writing. -
ros2_tracing/ LTTng is built for offline analysis: a session daemon plus post-processing of a CTF trace just to get a rate. On Humble it also needs ROS rebuilt with the lttng-ust backend (Jazzy and newer trace out of the box). - CARET (Tier IV) uses the same hook layer as this probe, LD_PRELOAD over tracetools, which is a useful independent validation of the mechanism. It is built for deep offline latency and chain analysis and needs LTTng, a forked rclcpp and Jupyter post-processing. Complementary, not always-on.
- eBPF uprobes need
CAP_SYS_ADMIN, debugfs and a kernel with BTF and uprobes, which is often a non-starter on Jetson and other embedded targets, and they pay a kernel trap per message.
ros2_pulse hooks the tracetools instrumentation layer that rclcpp already calls on every
publish and every callback, counts in-process with a lock-free hot path, and writes ready-to-read
Hz to a small rolling file.
What you get
# ts_ns=1782887153899445923 window_s=5.000
TOPIC /scan 20.000000                      # publish-side, inter-process
PUB   /points inter=0.000000 intra=30.000000   # publish-side incl. intra (Iron+)
RECV  /scan inter=20.000000 intra=0.000000 # receive-side, BOTH transports
RECV  /points inter=0.000000 intra=30.000000   # <- intra-process, invisible to other tools on Humble
JITTER /scan recv max_dt_ms=21.284             # largest inter-arrival gap (opt-in, see below)
NODE  /perception
NODE  /planner
WARN  TOPIC /scan hz=1.200000 expected=[18,22]  # only with an expected-rate spec (see below)
If a sidecar exporter or a log shipper is reading instead of a person, ROS_TOPIC_STATS_FORMAT=jsonl
writes every window as one JSON object per line with the same gates and values. See
JSON Lines output. Dashboards that already
read rclcpp’s built-in topic statistics get the same numbers on /statistics from the
pulse_bridge sidecar, and Prometheus, OTLP and
Grafana get them from pulse-export.
How it works
libros2_pulse.so is injected with LD_PRELOAD. It exports the same symbols as
libtracetools.so’s tracepoint API (ros_trace_rcl_publish, ros_trace_callback_start, the
init tracepoints and so on). The dynamic linker binds rclcpp’s calls to ours first; each
interposer records a stat and forwards to the real function through dlsym(RTLD_NEXT, ...).
rclcpp calls these functions unconditionally (the LTTng enable check is inside them), so the
probe works with no tracing session and adds no DDS traffic.
- Intra-process visibility comes from
callback_start(callback, is_intra_process), which fires for every subscription callback regardless of transport. - The hot path is a per-endpoint relaxed atomic increment behind a 256-slot thread-local cache with a stride-breaking hash. No global lock, no per-message string hashing. Counting costs about 0.3 ns/op on a fixed endpoint and 0.6 to 1.2 ns/op alternating across a working set on the reference box, two orders of magnitude under a single LTTng-UST tracepoint (about 158 ns).
- A background timer snapshots and resets the counts every
ROS_TOPIC_STATISTICS_PUBLISH_PERIODseconds and appends the rates toROS_TOPIC_STATS_OUTPUT_FILE.
The pure C++ core (core/) has no ROS dependency and is unit tested on its own; the probe layer
(probe/) is a thin LD_PRELOAD shim.
Install
apt
File truncated at 100 lines see the full file
CONTRIBUTING
Contributing to ros2_pulse
Thanks for your interest. This is a small, focused package; contributions that keep it small and focused are the most welcome.
Ground rules
-
The core stays pure.
include/ros2_pulse/core/andsrc/core/must not depend on ROS, rclcpp, or tracetools. All ROS/tracetools coupling lives insrc/probe/. This is what keeps the logic unit-testable in isolation. -
The hot path stays cheap.
onPublish/onCallbackStartrun per message. No allocations, no string hashing, no global locks, per-endpoint atomics + the thread-local cache only. - No DDS traffic, no privileges. The probe writes a local file and opens no sockets. Keep it that way.
Dev workflow
# unit tests (pure core, no ROS): the fastest loop
GT=/opt/ros/humble/src/gtest_vendor
g++ -O2 -std=c++17 -pthread -Iinclude -I$GT/include -I$GT \
  test/unit/test_topic_registry.cpp src/core/topic_registry.cpp $GT/src/gtest-all.cc -o /tmp/ut && /tmp/ut

# full suite (unit + integration)
colcon build --packages-select ros2_pulse
colcon test --packages-select ros2_pulse && colcon test-result --verbose

# benchmark / overhead (see bench/README.md)
Pull requests
- Add or update tests for any behavior change (
test/unitfor core,test/integrationfor the probe end-to-end). - Run
colcon testand include the result in the PR. - For performance-affecting changes, run
bench/run_overhead_repeated.shand paste the numbers. - Keep commits conventional (
feat:,fix:,perf:,docs:,test:).
Reporting bugs
Open an issue with: ROS distro, RMW (FastRTPS/CycloneDDS), whether intra-process comms are on, the
relevant pulse.log window, and nm -D libtracetools.so | grep -c ros_trace output.
Repository Summary
| Checkout URI | https://github.com/TanayK07/ros2_pulse.git |
| VCS Type | git |
| VCS Version | main |
| Last Updated | 2026-10-02 |
| Dev Status | DEVELOPED |
| Released | RELEASED |
| Contributing |
Help Wanted (-)
Good First Issues (-) Pull Requests to Review (-) |
Packages
| Name | Version |
|---|---|
| ros2_pulse | 0.5.0 |
README
ros2_pulse
The heartbeat of your ROS 2 graph. A low-overhead probe that measures per-topic message rate and active-node liveness for both inter-process and intra-process traffic, on stock ROS 2 binaries, with no rebuild, no privileges and no network traffic. The counting hot path costs under a nanosecond per message; the whole probe costs about 2 % of workload CPU on a harsh 4,900 msg/s stress and less on real graphs.
pulse-top --demo: the probe’s log, live. Sparklines per topic, intra-process rates, structured warnings with ages. Install: pip3 install ros2-pulse-top (details).
Forty seconds on what watching a topic costs and what the probe does instead. Watch the video (40 s, YouTube) or read the docs.
The long version, for systems programmers: Watching a ROS 2 topic changes it, the observer-effect measurement and the symbol-interposition trick that avoids it.
Why
The question in production is simple: is every topic flowing at the rate it should, and which nodes are alive? The existing tools each fall short of answering it.
-
ros2 topic hzandros2 topic echosubscribe to one topic at a time. Watching a single 100 KB topic costs 7 % of a core withhzand 31 % withecho, they cannot see intra-process messages at all, and pointinghzat an intra-process topic makes the publisher start serializing every message, which raised the watched process’s CPU by 52 % in our measurements. - Built-in topic statistics are
bypassed by intra-process comms on Humble-class
binaries, so composable nodes carrying point clouds lose all introspection. This is fixed on
rollingand newer by rclcpp#3130 (merged April 2026); there is no public Humble backport as of this writing. -
ros2_tracing/ LTTng is built for offline analysis: a session daemon plus post-processing of a CTF trace just to get a rate. On Humble it also needs ROS rebuilt with the lttng-ust backend (Jazzy and newer trace out of the box). - CARET (Tier IV) uses the same hook layer as this probe, LD_PRELOAD over tracetools, which is a useful independent validation of the mechanism. It is built for deep offline latency and chain analysis and needs LTTng, a forked rclcpp and Jupyter post-processing. Complementary, not always-on.
- eBPF uprobes need
CAP_SYS_ADMIN, debugfs and a kernel with BTF and uprobes, which is often a non-starter on Jetson and other embedded targets, and they pay a kernel trap per message.
ros2_pulse hooks the tracetools instrumentation layer that rclcpp already calls on every
publish and every callback, counts in-process with a lock-free hot path, and writes ready-to-read
Hz to a small rolling file.
What you get
# ts_ns=1782887153899445923 window_s=5.000
TOPIC /scan 20.000000                      # publish-side, inter-process
PUB   /points inter=0.000000 intra=30.000000   # publish-side incl. intra (Iron+)
RECV  /scan inter=20.000000 intra=0.000000 # receive-side, BOTH transports
RECV  /points inter=0.000000 intra=30.000000   # <- intra-process, invisible to other tools on Humble
JITTER /scan recv max_dt_ms=21.284             # largest inter-arrival gap (opt-in, see below)
NODE  /perception
NODE  /planner
WARN  TOPIC /scan hz=1.200000 expected=[18,22]  # only with an expected-rate spec (see below)
If a sidecar exporter or a log shipper is reading instead of a person, ROS_TOPIC_STATS_FORMAT=jsonl
writes every window as one JSON object per line with the same gates and values. See
JSON Lines output. Dashboards that already
read rclcpp’s built-in topic statistics get the same numbers on /statistics from the
pulse_bridge sidecar, and Prometheus, OTLP and
Grafana get them from pulse-export.
How it works
libros2_pulse.so is injected with LD_PRELOAD. It exports the same symbols as
libtracetools.so’s tracepoint API (ros_trace_rcl_publish, ros_trace_callback_start, the
init tracepoints and so on). The dynamic linker binds rclcpp’s calls to ours first; each
interposer records a stat and forwards to the real function through dlsym(RTLD_NEXT, ...).
rclcpp calls these functions unconditionally (the LTTng enable check is inside them), so the
probe works with no tracing session and adds no DDS traffic.
- Intra-process visibility comes from
callback_start(callback, is_intra_process), which fires for every subscription callback regardless of transport. - The hot path is a per-endpoint relaxed atomic increment behind a 256-slot thread-local cache with a stride-breaking hash. No global lock, no per-message string hashing. Counting costs about 0.3 ns/op on a fixed endpoint and 0.6 to 1.2 ns/op alternating across a working set on the reference box, two orders of magnitude under a single LTTng-UST tracepoint (about 158 ns).
- A background timer snapshots and resets the counts every
ROS_TOPIC_STATISTICS_PUBLISH_PERIODseconds and appends the rates toROS_TOPIC_STATS_OUTPUT_FILE.
The pure C++ core (core/) has no ROS dependency and is unit tested on its own; the probe layer
(probe/) is a thin LD_PRELOAD shim.
Install
apt
File truncated at 100 lines see the full file
CONTRIBUTING
Contributing to ros2_pulse
Thanks for your interest. This is a small, focused package; contributions that keep it small and focused are the most welcome.
Ground rules
-
The core stays pure.
include/ros2_pulse/core/andsrc/core/must not depend on ROS, rclcpp, or tracetools. All ROS/tracetools coupling lives insrc/probe/. This is what keeps the logic unit-testable in isolation. -
The hot path stays cheap.
onPublish/onCallbackStartrun per message. No allocations, no string hashing, no global locks, per-endpoint atomics + the thread-local cache only. - No DDS traffic, no privileges. The probe writes a local file and opens no sockets. Keep it that way.
Dev workflow
# unit tests (pure core, no ROS): the fastest loop
GT=/opt/ros/humble/src/gtest_vendor
g++ -O2 -std=c++17 -pthread -Iinclude -I$GT/include -I$GT \
  test/unit/test_topic_registry.cpp src/core/topic_registry.cpp $GT/src/gtest-all.cc -o /tmp/ut && /tmp/ut

# full suite (unit + integration)
colcon build --packages-select ros2_pulse
colcon test --packages-select ros2_pulse && colcon test-result --verbose

# benchmark / overhead (see bench/README.md)
Pull requests
- Add or update tests for any behavior change (
test/unitfor core,test/integrationfor the probe end-to-end). - Run
colcon testand include the result in the PR. - For performance-affecting changes, run
bench/run_overhead_repeated.shand paste the numbers. - Keep commits conventional (
feat:,fix:,perf:,docs:,test:).
Reporting bugs
Open an issue with: ROS distro, RMW (FastRTPS/CycloneDDS), whether intra-process comms are on, the
relevant pulse.log window, and nm -D libtracetools.so | grep -c ros_trace output.
Repository Summary
| Checkout URI | https://github.com/TanayK07/ros2_pulse.git |
| VCS Type | git |
| VCS Version | main |
| Last Updated | 2026-10-02 |
| Dev Status | DEVELOPED |
| Released | RELEASED |
| Contributing |
Help Wanted (-)
Good First Issues (-) Pull Requests to Review (-) |
Packages
| Name | Version |
|---|---|
| ros2_pulse | 0.5.0 |
README
ros2_pulse
The heartbeat of your ROS 2 graph. A low-overhead probe that measures per-topic message rate and active-node liveness for both inter-process and intra-process traffic, on stock ROS 2 binaries, with no rebuild, no privileges and no network traffic. The counting hot path costs under a nanosecond per message; the whole probe costs about 2 % of workload CPU on a harsh 4,900 msg/s stress and less on real graphs.
pulse-top --demo: the probe’s log, live. Sparklines per topic, intra-process rates, structured warnings with ages. Install: pip3 install ros2-pulse-top (details).
Forty seconds on what watching a topic costs and what the probe does instead. Watch the video (40 s, YouTube) or read the docs.
The long version, for systems programmers: Watching a ROS 2 topic changes it, the observer-effect measurement and the symbol-interposition trick that avoids it.
Why
The question in production is simple: is every topic flowing at the rate it should, and which nodes are alive? The existing tools each fall short of answering it.
-
ros2 topic hzandros2 topic echosubscribe to one topic at a time. Watching a single 100 KB topic costs 7 % of a core withhzand 31 % withecho, they cannot see intra-process messages at all, and pointinghzat an intra-process topic makes the publisher start serializing every message, which raised the watched process’s CPU by 52 % in our measurements. - Built-in topic statistics are
bypassed by intra-process comms on Humble-class
binaries, so composable nodes carrying point clouds lose all introspection. This is fixed on
rollingand newer by rclcpp#3130 (merged April 2026); there is no public Humble backport as of this writing. -
ros2_tracing/ LTTng is built for offline analysis: a session daemon plus post-processing of a CTF trace just to get a rate. On Humble it also needs ROS rebuilt with the lttng-ust backend (Jazzy and newer trace out of the box). - CARET (Tier IV) uses the same hook layer as this probe, LD_PRELOAD over tracetools, which is a useful independent validation of the mechanism. It is built for deep offline latency and chain analysis and needs LTTng, a forked rclcpp and Jupyter post-processing. Complementary, not always-on.
- eBPF uprobes need
CAP_SYS_ADMIN, debugfs and a kernel with BTF and uprobes, which is often a non-starter on Jetson and other embedded targets, and they pay a kernel trap per message.
ros2_pulse hooks the tracetools instrumentation layer that rclcpp already calls on every
publish and every callback, counts in-process with a lock-free hot path, and writes ready-to-read
Hz to a small rolling file.
What you get
# ts_ns=1782887153899445923 window_s=5.000
TOPIC /scan 20.000000                      # publish-side, inter-process
PUB   /points inter=0.000000 intra=30.000000   # publish-side incl. intra (Iron+)
RECV  /scan inter=20.000000 intra=0.000000 # receive-side, BOTH transports
RECV  /points inter=0.000000 intra=30.000000   # <- intra-process, invisible to other tools on Humble
JITTER /scan recv max_dt_ms=21.284             # largest inter-arrival gap (opt-in, see below)
NODE  /perception
NODE  /planner
WARN  TOPIC /scan hz=1.200000 expected=[18,22]  # only with an expected-rate spec (see below)
If a sidecar exporter or a log shipper is reading instead of a person, ROS_TOPIC_STATS_FORMAT=jsonl
writes every window as one JSON object per line with the same gates and values. See
JSON Lines output. Dashboards that already
read rclcpp’s built-in topic statistics get the same numbers on /statistics from the
pulse_bridge sidecar, and Prometheus, OTLP and
Grafana get them from pulse-export.
How it works
libros2_pulse.so is injected with LD_PRELOAD. It exports the same symbols as
libtracetools.so’s tracepoint API (ros_trace_rcl_publish, ros_trace_callback_start, the
init tracepoints and so on). The dynamic linker binds rclcpp’s calls to ours first; each
interposer records a stat and forwards to the real function through dlsym(RTLD_NEXT, ...).
rclcpp calls these functions unconditionally (the LTTng enable check is inside them), so the
probe works with no tracing session and adds no DDS traffic.
- Intra-process visibility comes from
callback_start(callback, is_intra_process), which fires for every subscription callback regardless of transport. - The hot path is a per-endpoint relaxed atomic increment behind a 256-slot thread-local cache with a stride-breaking hash. No global lock, no per-message string hashing. Counting costs about 0.3 ns/op on a fixed endpoint and 0.6 to 1.2 ns/op alternating across a working set on the reference box, two orders of magnitude under a single LTTng-UST tracepoint (about 158 ns).
- A background timer snapshots and resets the counts every
ROS_TOPIC_STATISTICS_PUBLISH_PERIODseconds and appends the rates toROS_TOPIC_STATS_OUTPUT_FILE.
The pure C++ core (core/) has no ROS dependency and is unit tested on its own; the probe layer
(probe/) is a thin LD_PRELOAD shim.
Install
apt
File truncated at 100 lines see the full file
CONTRIBUTING
Contributing to ros2_pulse
Thanks for your interest. This is a small, focused package; contributions that keep it small and focused are the most welcome.
Ground rules
-
The core stays pure.
include/ros2_pulse/core/andsrc/core/must not depend on ROS, rclcpp, or tracetools. All ROS/tracetools coupling lives insrc/probe/. This is what keeps the logic unit-testable in isolation. -
The hot path stays cheap.
onPublish/onCallbackStartrun per message. No allocations, no string hashing, no global locks, per-endpoint atomics + the thread-local cache only. - No DDS traffic, no privileges. The probe writes a local file and opens no sockets. Keep it that way.
Dev workflow
# unit tests (pure core, no ROS): the fastest loop
GT=/opt/ros/humble/src/gtest_vendor
g++ -O2 -std=c++17 -pthread -Iinclude -I$GT/include -I$GT \
  test/unit/test_topic_registry.cpp src/core/topic_registry.cpp $GT/src/gtest-all.cc -o /tmp/ut && /tmp/ut

# full suite (unit + integration)
colcon build --packages-select ros2_pulse
colcon test --packages-select ros2_pulse && colcon test-result --verbose

# benchmark / overhead (see bench/README.md)
Pull requests
- Add or update tests for any behavior change (
test/unitfor core,test/integrationfor the probe end-to-end). - Run
colcon testand include the result in the PR. - For performance-affecting changes, run
bench/run_overhead_repeated.shand paste the numbers. - Keep commits conventional (
feat:,fix:,perf:,docs:,test:).
Reporting bugs
Open an issue with: ROS distro, RMW (FastRTPS/CycloneDDS), whether intra-process comms are on, the
relevant pulse.log window, and nm -D libtracetools.so | grep -c ros_trace output.
Repository Summary
| Checkout URI | https://github.com/TanayK07/ros2_pulse.git |
| VCS Type | git |
| VCS Version | main |
| Last Updated | 2026-10-02 |
| Dev Status | DEVELOPED |
| Released | RELEASED |
| Contributing |
Help Wanted (-)
Good First Issues (-) Pull Requests to Review (-) |
Packages
| Name | Version |
|---|---|
| ros2_pulse | 0.5.0 |
README
ros2_pulse
The heartbeat of your ROS 2 graph. A low-overhead probe that measures per-topic message rate and active-node liveness for both inter-process and intra-process traffic, on stock ROS 2 binaries, with no rebuild, no privileges and no network traffic. The counting hot path costs under a nanosecond per message; the whole probe costs about 2 % of workload CPU on a harsh 4,900 msg/s stress and less on real graphs.
pulse-top --demo: the probe’s log, live. Sparklines per topic, intra-process rates, structured warnings with ages. Install: pip3 install ros2-pulse-top (details).
Forty seconds on what watching a topic costs and what the probe does instead. Watch the video (40 s, YouTube) or read the docs.
The long version, for systems programmers: Watching a ROS 2 topic changes it, the observer-effect measurement and the symbol-interposition trick that avoids it.
Why
The question in production is simple: is every topic flowing at the rate it should, and which nodes are alive? The existing tools each fall short of answering it.
-
ros2 topic hzandros2 topic echosubscribe to one topic at a time. Watching a single 100 KB topic costs 7 % of a core withhzand 31 % withecho, they cannot see intra-process messages at all, and pointinghzat an intra-process topic makes the publisher start serializing every message, which raised the watched process’s CPU by 52 % in our measurements. - Built-in topic statistics are
bypassed by intra-process comms on Humble-class
binaries, so composable nodes carrying point clouds lose all introspection. This is fixed on
rollingand newer by rclcpp#3130 (merged April 2026); there is no public Humble backport as of this writing. -
ros2_tracing/ LTTng is built for offline analysis: a session daemon plus post-processing of a CTF trace just to get a rate. On Humble it also needs ROS rebuilt with the lttng-ust backend (Jazzy and newer trace out of the box). - CARET (Tier IV) uses the same hook layer as this probe, LD_PRELOAD over tracetools, which is a useful independent validation of the mechanism. It is built for deep offline latency and chain analysis and needs LTTng, a forked rclcpp and Jupyter post-processing. Complementary, not always-on.
- eBPF uprobes need
CAP_SYS_ADMIN, debugfs and a kernel with BTF and uprobes, which is often a non-starter on Jetson and other embedded targets, and they pay a kernel trap per message.
ros2_pulse hooks the tracetools instrumentation layer that rclcpp already calls on every
publish and every callback, counts in-process with a lock-free hot path, and writes ready-to-read
Hz to a small rolling file.
What you get
# ts_ns=1782887153899445923 window_s=5.000
TOPIC /scan 20.000000                      # publish-side, inter-process
PUB   /points inter=0.000000 intra=30.000000   # publish-side incl. intra (Iron+)
RECV  /scan inter=20.000000 intra=0.000000 # receive-side, BOTH transports
RECV  /points inter=0.000000 intra=30.000000   # <- intra-process, invisible to other tools on Humble
JITTER /scan recv max_dt_ms=21.284             # largest inter-arrival gap (opt-in, see below)
NODE  /perception
NODE  /planner
WARN  TOPIC /scan hz=1.200000 expected=[18,22]  # only with an expected-rate spec (see below)
If a sidecar exporter or a log shipper is reading instead of a person, ROS_TOPIC_STATS_FORMAT=jsonl
writes every window as one JSON object per line with the same gates and values. See
JSON Lines output. Dashboards that already
read rclcpp’s built-in topic statistics get the same numbers on /statistics from the
pulse_bridge sidecar, and Prometheus, OTLP and
Grafana get them from pulse-export.
How it works
libros2_pulse.so is injected with LD_PRELOAD. It exports the same symbols as
libtracetools.so’s tracepoint API (ros_trace_rcl_publish, ros_trace_callback_start, the
init tracepoints and so on). The dynamic linker binds rclcpp’s calls to ours first; each
interposer records a stat and forwards to the real function through dlsym(RTLD_NEXT, ...).
rclcpp calls these functions unconditionally (the LTTng enable check is inside them), so the
probe works with no tracing session and adds no DDS traffic.
- Intra-process visibility comes from
callback_start(callback, is_intra_process), which fires for every subscription callback regardless of transport. - The hot path is a per-endpoint relaxed atomic increment behind a 256-slot thread-local cache with a stride-breaking hash. No global lock, no per-message string hashing. Counting costs about 0.3 ns/op on a fixed endpoint and 0.6 to 1.2 ns/op alternating across a working set on the reference box, two orders of magnitude under a single LTTng-UST tracepoint (about 158 ns).
- A background timer snapshots and resets the counts every
ROS_TOPIC_STATISTICS_PUBLISH_PERIODseconds and appends the rates toROS_TOPIC_STATS_OUTPUT_FILE.
The pure C++ core (core/) has no ROS dependency and is unit tested on its own; the probe layer
(probe/) is a thin LD_PRELOAD shim.
Install
apt
File truncated at 100 lines see the full file
CONTRIBUTING
Contributing to ros2_pulse
Thanks for your interest. This is a small, focused package; contributions that keep it small and focused are the most welcome.
Ground rules
-
The core stays pure.
include/ros2_pulse/core/andsrc/core/must not depend on ROS, rclcpp, or tracetools. All ROS/tracetools coupling lives insrc/probe/. This is what keeps the logic unit-testable in isolation. -
The hot path stays cheap.
onPublish/onCallbackStartrun per message. No allocations, no string hashing, no global locks, per-endpoint atomics + the thread-local cache only. - No DDS traffic, no privileges. The probe writes a local file and opens no sockets. Keep it that way.
Dev workflow
# unit tests (pure core, no ROS): the fastest loop
GT=/opt/ros/humble/src/gtest_vendor
g++ -O2 -std=c++17 -pthread -Iinclude -I$GT/include -I$GT \
  test/unit/test_topic_registry.cpp src/core/topic_registry.cpp $GT/src/gtest-all.cc -o /tmp/ut && /tmp/ut

# full suite (unit + integration)
colcon build --packages-select ros2_pulse
colcon test --packages-select ros2_pulse && colcon test-result --verbose

# benchmark / overhead (see bench/README.md)
Pull requests
- Add or update tests for any behavior change (
test/unitfor core,test/integrationfor the probe end-to-end). - Run
colcon testand include the result in the PR. - For performance-affecting changes, run
bench/run_overhead_repeated.shand paste the numbers. - Keep commits conventional (
feat:,fix:,perf:,docs:,test:).
Reporting bugs
Open an issue with: ROS distro, RMW (FastRTPS/CycloneDDS), whether intra-process comms are on, the
relevant pulse.log window, and nm -D libtracetools.so | grep -c ros_trace output.
Repository Summary
| Checkout URI | https://github.com/TanayK07/ros2_pulse.git |
| VCS Type | git |
| VCS Version | main |
| Last Updated | 2026-10-02 |
| Dev Status | DEVELOPED |
| Released | RELEASED |
| Contributing |
Help Wanted (-)
Good First Issues (-) Pull Requests to Review (-) |
Packages
| Name | Version |
|---|---|
| ros2_pulse | 0.5.0 |
README
ros2_pulse
The heartbeat of your ROS 2 graph. A low-overhead probe that measures per-topic message rate and active-node liveness for both inter-process and intra-process traffic, on stock ROS 2 binaries, with no rebuild, no privileges and no network traffic. The counting hot path costs under a nanosecond per message; the whole probe costs about 2 % of workload CPU on a harsh 4,900 msg/s stress and less on real graphs.
pulse-top --demo: the probe’s log, live. Sparklines per topic, intra-process rates, structured warnings with ages. Install: pip3 install ros2-pulse-top (details).
Forty seconds on what watching a topic costs and what the probe does instead. Watch the video (40 s, YouTube) or read the docs.
The long version, for systems programmers: Watching a ROS 2 topic changes it, the observer-effect measurement and the symbol-interposition trick that avoids it.
Why
The question in production is simple: is every topic flowing at the rate it should, and which nodes are alive? The existing tools each fall short of answering it.
-
ros2 topic hzandros2 topic echosubscribe to one topic at a time. Watching a single 100 KB topic costs 7 % of a core withhzand 31 % withecho, they cannot see intra-process messages at all, and pointinghzat an intra-process topic makes the publisher start serializing every message, which raised the watched process’s CPU by 52 % in our measurements. - Built-in topic statistics are
bypassed by intra-process comms on Humble-class
binaries, so composable nodes carrying point clouds lose all introspection. This is fixed on
rollingand newer by rclcpp#3130 (merged April 2026); there is no public Humble backport as of this writing. -
ros2_tracing/ LTTng is built for offline analysis: a session daemon plus post-processing of a CTF trace just to get a rate. On Humble it also needs ROS rebuilt with the lttng-ust backend (Jazzy and newer trace out of the box). - CARET (Tier IV) uses the same hook layer as this probe, LD_PRELOAD over tracetools, which is a useful independent validation of the mechanism. It is built for deep offline latency and chain analysis and needs LTTng, a forked rclcpp and Jupyter post-processing. Complementary, not always-on.
- eBPF uprobes need
CAP_SYS_ADMIN, debugfs and a kernel with BTF and uprobes, which is often a non-starter on Jetson and other embedded targets, and they pay a kernel trap per message.
ros2_pulse hooks the tracetools instrumentation layer that rclcpp already calls on every
publish and every callback, counts in-process with a lock-free hot path, and writes ready-to-read
Hz to a small rolling file.
What you get
# ts_ns=1782887153899445923 window_s=5.000
TOPIC /scan 20.000000                      # publish-side, inter-process
PUB   /points inter=0.000000 intra=30.000000   # publish-side incl. intra (Iron+)
RECV  /scan inter=20.000000 intra=0.000000 # receive-side, BOTH transports
RECV  /points inter=0.000000 intra=30.000000   # <- intra-process, invisible to other tools on Humble
JITTER /scan recv max_dt_ms=21.284             # largest inter-arrival gap (opt-in, see below)
NODE  /perception
NODE  /planner
WARN  TOPIC /scan hz=1.200000 expected=[18,22]  # only with an expected-rate spec (see below)
If a sidecar exporter or a log shipper is reading instead of a person, ROS_TOPIC_STATS_FORMAT=jsonl
writes every window as one JSON object per line with the same gates and values. See
JSON Lines output. Dashboards that already
read rclcpp’s built-in topic statistics get the same numbers on /statistics from the
pulse_bridge sidecar, and Prometheus, OTLP and
Grafana get them from pulse-export.
How it works
libros2_pulse.so is injected with LD_PRELOAD. It exports the same symbols as
libtracetools.so’s tracepoint API (ros_trace_rcl_publish, ros_trace_callback_start, the
init tracepoints and so on). The dynamic linker binds rclcpp’s calls to ours first; each
interposer records a stat and forwards to the real function through dlsym(RTLD_NEXT, ...).
rclcpp calls these functions unconditionally (the LTTng enable check is inside them), so the
probe works with no tracing session and adds no DDS traffic.
- Intra-process visibility comes from
callback_start(callback, is_intra_process), which fires for every subscription callback regardless of transport. - The hot path is a per-endpoint relaxed atomic increment behind a 256-slot thread-local cache with a stride-breaking hash. No global lock, no per-message string hashing. Counting costs about 0.3 ns/op on a fixed endpoint and 0.6 to 1.2 ns/op alternating across a working set on the reference box, two orders of magnitude under a single LTTng-UST tracepoint (about 158 ns).
- A background timer snapshots and resets the counts every
ROS_TOPIC_STATISTICS_PUBLISH_PERIODseconds and appends the rates toROS_TOPIC_STATS_OUTPUT_FILE.
The pure C++ core (core/) has no ROS dependency and is unit tested on its own; the probe layer
(probe/) is a thin LD_PRELOAD shim.
Install
apt
File truncated at 100 lines see the full file
CONTRIBUTING
Contributing to ros2_pulse
Thanks for your interest. This is a small, focused package; contributions that keep it small and focused are the most welcome.
Ground rules
-
The core stays pure.
include/ros2_pulse/core/andsrc/core/must not depend on ROS, rclcpp, or tracetools. All ROS/tracetools coupling lives insrc/probe/. This is what keeps the logic unit-testable in isolation. -
The hot path stays cheap.
onPublish/onCallbackStartrun per message. No allocations, no string hashing, no global locks, per-endpoint atomics + the thread-local cache only. - No DDS traffic, no privileges. The probe writes a local file and opens no sockets. Keep it that way.
Dev workflow
# unit tests (pure core, no ROS): the fastest loop
GT=/opt/ros/humble/src/gtest_vendor
g++ -O2 -std=c++17 -pthread -Iinclude -I$GT/include -I$GT \
  test/unit/test_topic_registry.cpp src/core/topic_registry.cpp $GT/src/gtest-all.cc -o /tmp/ut && /tmp/ut

# full suite (unit + integration)
colcon build --packages-select ros2_pulse
colcon test --packages-select ros2_pulse && colcon test-result --verbose

# benchmark / overhead (see bench/README.md)
Pull requests
- Add or update tests for any behavior change (
test/unitfor core,test/integrationfor the probe end-to-end). - Run
colcon testand include the result in the PR. - For performance-affecting changes, run
bench/run_overhead_repeated.shand paste the numbers. - Keep commits conventional (
feat:,fix:,perf:,docs:,test:).
Reporting bugs
Open an issue with: ROS distro, RMW (FastRTPS/CycloneDDS), whether intra-process comms are on, the
relevant pulse.log window, and nm -D libtracetools.so | grep -c ros_trace output.
Repository Summary
| Checkout URI | https://github.com/TanayK07/ros2_pulse.git |
| VCS Type | git |
| VCS Version | main |
| Last Updated | 2026-10-02 |
| Dev Status | DEVELOPED |
| Released | RELEASED |
| Contributing |
Help Wanted (-)
Good First Issues (-) Pull Requests to Review (-) |
Packages
| Name | Version |
|---|---|
| ros2_pulse | 0.5.0 |
README
ros2_pulse
The heartbeat of your ROS 2 graph. A low-overhead probe that measures per-topic message rate and active-node liveness for both inter-process and intra-process traffic, on stock ROS 2 binaries, with no rebuild, no privileges and no network traffic. The counting hot path costs under a nanosecond per message; the whole probe costs about 2 % of workload CPU on a harsh 4,900 msg/s stress and less on real graphs.
pulse-top --demo: the probe’s log, live. Sparklines per topic, intra-process rates, structured warnings with ages. Install: pip3 install ros2-pulse-top (details).
Forty seconds on what watching a topic costs and what the probe does instead. Watch the video (40 s, YouTube) or read the docs.
The long version, for systems programmers: Watching a ROS 2 topic changes it, the observer-effect measurement and the symbol-interposition trick that avoids it.
Why
The question in production is simple: is every topic flowing at the rate it should, and which nodes are alive? The existing tools each fall short of answering it.
-
ros2 topic hzandros2 topic echosubscribe to one topic at a time. Watching a single 100 KB topic costs 7 % of a core withhzand 31 % withecho, they cannot see intra-process messages at all, and pointinghzat an intra-process topic makes the publisher start serializing every message, which raised the watched process’s CPU by 52 % in our measurements. - Built-in topic statistics are
bypassed by intra-process comms on Humble-class
binaries, so composable nodes carrying point clouds lose all introspection. This is fixed on
rollingand newer by rclcpp#3130 (merged April 2026); there is no public Humble backport as of this writing. -
ros2_tracing/ LTTng is built for offline analysis: a session daemon plus post-processing of a CTF trace just to get a rate. On Humble it also needs ROS rebuilt with the lttng-ust backend (Jazzy and newer trace out of the box). - CARET (Tier IV) uses the same hook layer as this probe, LD_PRELOAD over tracetools, which is a useful independent validation of the mechanism. It is built for deep offline latency and chain analysis and needs LTTng, a forked rclcpp and Jupyter post-processing. Complementary, not always-on.
- eBPF uprobes need
CAP_SYS_ADMIN, debugfs and a kernel with BTF and uprobes, which is often a non-starter on Jetson and other embedded targets, and they pay a kernel trap per message.
ros2_pulse hooks the tracetools instrumentation layer that rclcpp already calls on every
publish and every callback, counts in-process with a lock-free hot path, and writes ready-to-read
Hz to a small rolling file.
What you get
# ts_ns=1782887153899445923 window_s=5.000
TOPIC /scan 20.000000                      # publish-side, inter-process
PUB   /points inter=0.000000 intra=30.000000   # publish-side incl. intra (Iron+)
RECV  /scan inter=20.000000 intra=0.000000 # receive-side, BOTH transports
RECV  /points inter=0.000000 intra=30.000000   # <- intra-process, invisible to other tools on Humble
JITTER /scan recv max_dt_ms=21.284             # largest inter-arrival gap (opt-in, see below)
NODE  /perception
NODE  /planner
WARN  TOPIC /scan hz=1.200000 expected=[18,22]  # only with an expected-rate spec (see below)
If a sidecar exporter or a log shipper is reading instead of a person, ROS_TOPIC_STATS_FORMAT=jsonl
writes every window as one JSON object per line with the same gates and values. See
JSON Lines output. Dashboards that already
read rclcpp’s built-in topic statistics get the same numbers on /statistics from the
pulse_bridge sidecar, and Prometheus, OTLP and
Grafana get them from pulse-export.
How it works
libros2_pulse.so is injected with LD_PRELOAD. It exports the same symbols as
libtracetools.so’s tracepoint API (ros_trace_rcl_publish, ros_trace_callback_start, the
init tracepoints and so on). The dynamic linker binds rclcpp’s calls to ours first; each
interposer records a stat and forwards to the real function through dlsym(RTLD_NEXT, ...).
rclcpp calls these functions unconditionally (the LTTng enable check is inside them), so the
probe works with no tracing session and adds no DDS traffic.
- Intra-process visibility comes from
callback_start(callback, is_intra_process), which fires for every subscription callback regardless of transport. - The hot path is a per-endpoint relaxed atomic increment behind a 256-slot thread-local cache with a stride-breaking hash. No global lock, no per-message string hashing. Counting costs about 0.3 ns/op on a fixed endpoint and 0.6 to 1.2 ns/op alternating across a working set on the reference box, two orders of magnitude under a single LTTng-UST tracepoint (about 158 ns).
- A background timer snapshots and resets the counts every
ROS_TOPIC_STATISTICS_PUBLISH_PERIODseconds and appends the rates toROS_TOPIC_STATS_OUTPUT_FILE.
The pure C++ core (core/) has no ROS dependency and is unit tested on its own; the probe layer
(probe/) is a thin LD_PRELOAD shim.
Install
apt
File truncated at 100 lines see the full file
CONTRIBUTING
Contributing to ros2_pulse
Thanks for your interest. This is a small, focused package; contributions that keep it small and focused are the most welcome.
Ground rules
-
The core stays pure.
include/ros2_pulse/core/andsrc/core/must not depend on ROS, rclcpp, or tracetools. All ROS/tracetools coupling lives insrc/probe/. This is what keeps the logic unit-testable in isolation. -
The hot path stays cheap.
onPublish/onCallbackStartrun per message. No allocations, no string hashing, no global locks, per-endpoint atomics + the thread-local cache only. - No DDS traffic, no privileges. The probe writes a local file and opens no sockets. Keep it that way.
Dev workflow
# unit tests (pure core, no ROS): the fastest loop
GT=/opt/ros/humble/src/gtest_vendor
g++ -O2 -std=c++17 -pthread -Iinclude -I$GT/include -I$GT \
  test/unit/test_topic_registry.cpp src/core/topic_registry.cpp $GT/src/gtest-all.cc -o /tmp/ut && /tmp/ut

# full suite (unit + integration)
colcon build --packages-select ros2_pulse
colcon test --packages-select ros2_pulse && colcon test-result --verbose

# benchmark / overhead (see bench/README.md)
Pull requests
- Add or update tests for any behavior change (
test/unitfor core,test/integrationfor the probe end-to-end). - Run
colcon testand include the result in the PR. - For performance-affecting changes, run
bench/run_overhead_repeated.shand paste the numbers. - Keep commits conventional (
feat:,fix:,perf:,docs:,test:).
Reporting bugs
Open an issue with: ROS distro, RMW (FastRTPS/CycloneDDS), whether intra-process comms are on, the
relevant pulse.log window, and nm -D libtracetools.so | grep -c ros_trace output.