
Repository Summary
| Checkout URI | https://github.com/facontidavide/PlotJuggler.git |
| VCS Type | git |
| VCS Version | main |
| Last Updated | 2026-03-18 |
| Dev Status | DEVELOPED |
| Released | RELEASED |
| Contributing |
Help Wanted (-)
Good First Issues (-) Pull Requests to Review (-) |
Packages
| Name | Version |
|---|---|
| plotjuggler | 3.16.0 |
README

![]()
![]()
![]()
![]()
![]()

Gold Sponsor:


PlotJuggler 3.16
PlotJuggler is a tool to visualize time series that is fast, powerful and intuitive.
Noteworthy features:
- Simple Drag & Drop user interface.
- Load data from file.
- Connect to live streaming of data.
- Save the visualization layout and configurations to reuse them later.
- Fast OpenGL visualization.
- Can handle thousands of timeseries and millions of data points.
- Transform your data using a simple editor: derivative, moving average, integral, etc…
- PlotJuggler can be easily extended using plugins.
Data sources (file and streaming)
- Load CSV files.
- Load ULog (PX4).
- Subscribe to many different streaming sources: MQTT, WebSockets, ZeroMQ, UDP, etc.
- Understand data formats such as JSON, CBOR, BSON, Message Pack, etc.
- Well integrated with ROS: open rosbags and/or subscribe to ROS topics (both ROS1 and ROS2).
- Supports the Lab Streaming Layer, that is used by many devices.
- Easily add your custom data source and/or formats…

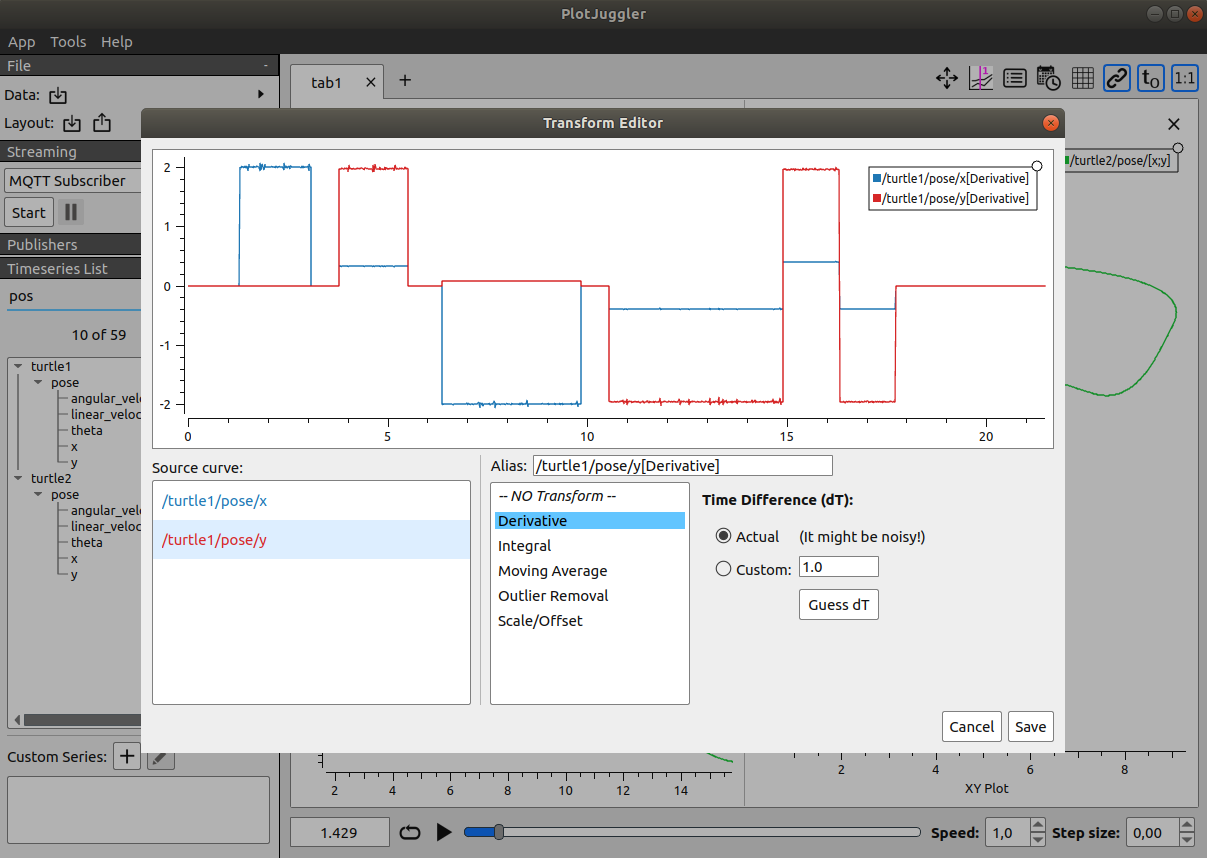
Transform and analyze your data
PlotJuggler makes it easy to visualize data but also to analyze it. You can manipulate your time series using a simple and extendable Transform Editor.
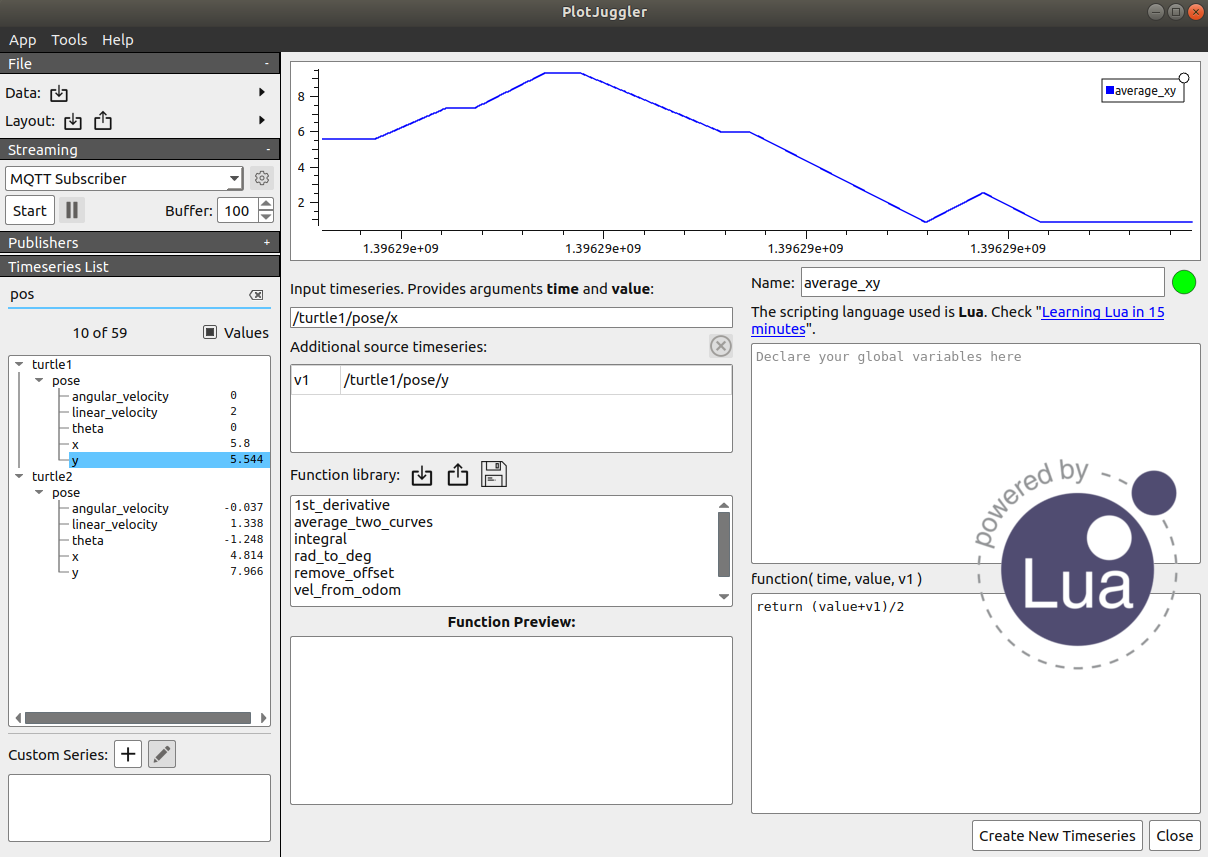
Alternatively, you may use the Custom Function Editor, which allows you to create Multi-input / Single-output functions using a scripting language based on Lua.
If you are not familiar with Lua, don’t be afraid, you won’t need more than 5 minutes to learn it ;)
Tutorials
To learn how to use PlotJuggler, check the tutorials here:
| Tutorial 1 | Tutorial 2 | Tutorial 3 |
|---|---|---|
 |
 |
 |
Supported plugins
Some plugins can be found in a different repository. The individual README files should include all the information needed to compile and use the plugin.
Please submit specific issues, Pull Requests and questions on the related Github repository:
If you want a simple example to learn how to write your own plugins, have a look at PlotJuggler/plotjuggler-sample-plugins
Installation
You can download the latest ready to use binaries from the Release page.
Snap (recommended in Ubuntu, to ROS users too)
The snap contains a version of PlotJuggler that works (with some limitations) with ROS2.

To install it in Ubuntu, run:
File truncated at 100 lines see the full file
CONTRIBUTING
Repository Summary
| Checkout URI | https://github.com/facontidavide/PlotJuggler.git |
| VCS Type | git |
| VCS Version | main |
| Last Updated | 2026-03-18 |
| Dev Status | DEVELOPED |
| Released | RELEASED |
| Contributing |
Help Wanted (-)
Good First Issues (-) Pull Requests to Review (-) |
Packages
| Name | Version |
|---|---|
| plotjuggler | 3.16.0 |
README
![]()
![]()
![]()
![]()
![]()
Gold Sponsor:
PlotJuggler 3.16
PlotJuggler is a tool to visualize time series that is fast, powerful and intuitive.
Noteworthy features:
- Simple Drag & Drop user interface.
- Load data from file.
- Connect to live streaming of data.
- Save the visualization layout and configurations to reuse them later.
- Fast OpenGL visualization.
- Can handle thousands of timeseries and millions of data points.
- Transform your data using a simple editor: derivative, moving average, integral, etc…
- PlotJuggler can be easily extended using plugins.
Data sources (file and streaming)
- Load CSV files.
- Load ULog (PX4).
- Subscribe to many different streaming sources: MQTT, WebSockets, ZeroMQ, UDP, etc.
- Understand data formats such as JSON, CBOR, BSON, Message Pack, etc.
- Well integrated with ROS: open rosbags and/or subscribe to ROS topics (both ROS1 and ROS2).
- Supports the Lab Streaming Layer, that is used by many devices.
- Easily add your custom data source and/or formats…
Transform and analyze your data
PlotJuggler makes it easy to visualize data but also to analyze it. You can manipulate your time series using a simple and extendable Transform Editor.
Alternatively, you may use the Custom Function Editor, which allows you to create Multi-input / Single-output functions using a scripting language based on Lua.
If you are not familiar with Lua, don’t be afraid, you won’t need more than 5 minutes to learn it ;)
Tutorials
To learn how to use PlotJuggler, check the tutorials here:
| Tutorial 1 | Tutorial 2 | Tutorial 3 |
|---|---|---|
|
|
|
Supported plugins
Some plugins can be found in a different repository. The individual README files should include all the information needed to compile and use the plugin.
Please submit specific issues, Pull Requests and questions on the related Github repository:
If you want a simple example to learn how to write your own plugins, have a look at PlotJuggler/plotjuggler-sample-plugins
Installation
You can download the latest ready to use binaries from the Release page.
Snap (recommended in Ubuntu, to ROS users too)
The snap contains a version of PlotJuggler that works (with some limitations) with ROS2.
To install it in Ubuntu, run:
File truncated at 100 lines see the full file