
Repository Summary
| Checkout URI | https://github.com/davetcoleman/ompl_visual_tools.git |
| VCS Type | git |
| VCS Version | jade-devel |
| Last Updated | 2016-02-05 |
| Dev Status | DEVELOPED |
| Released | RELEASED |
| Tags | No category tags. |
| Contributing |
Help Wanted (0)
Good First Issues (0) Pull Requests to Review (0) |
Packages
| Name | Version |
|---|---|
| ompl_visual_tools | 2.3.2 |
README
OMPL Visual Tools
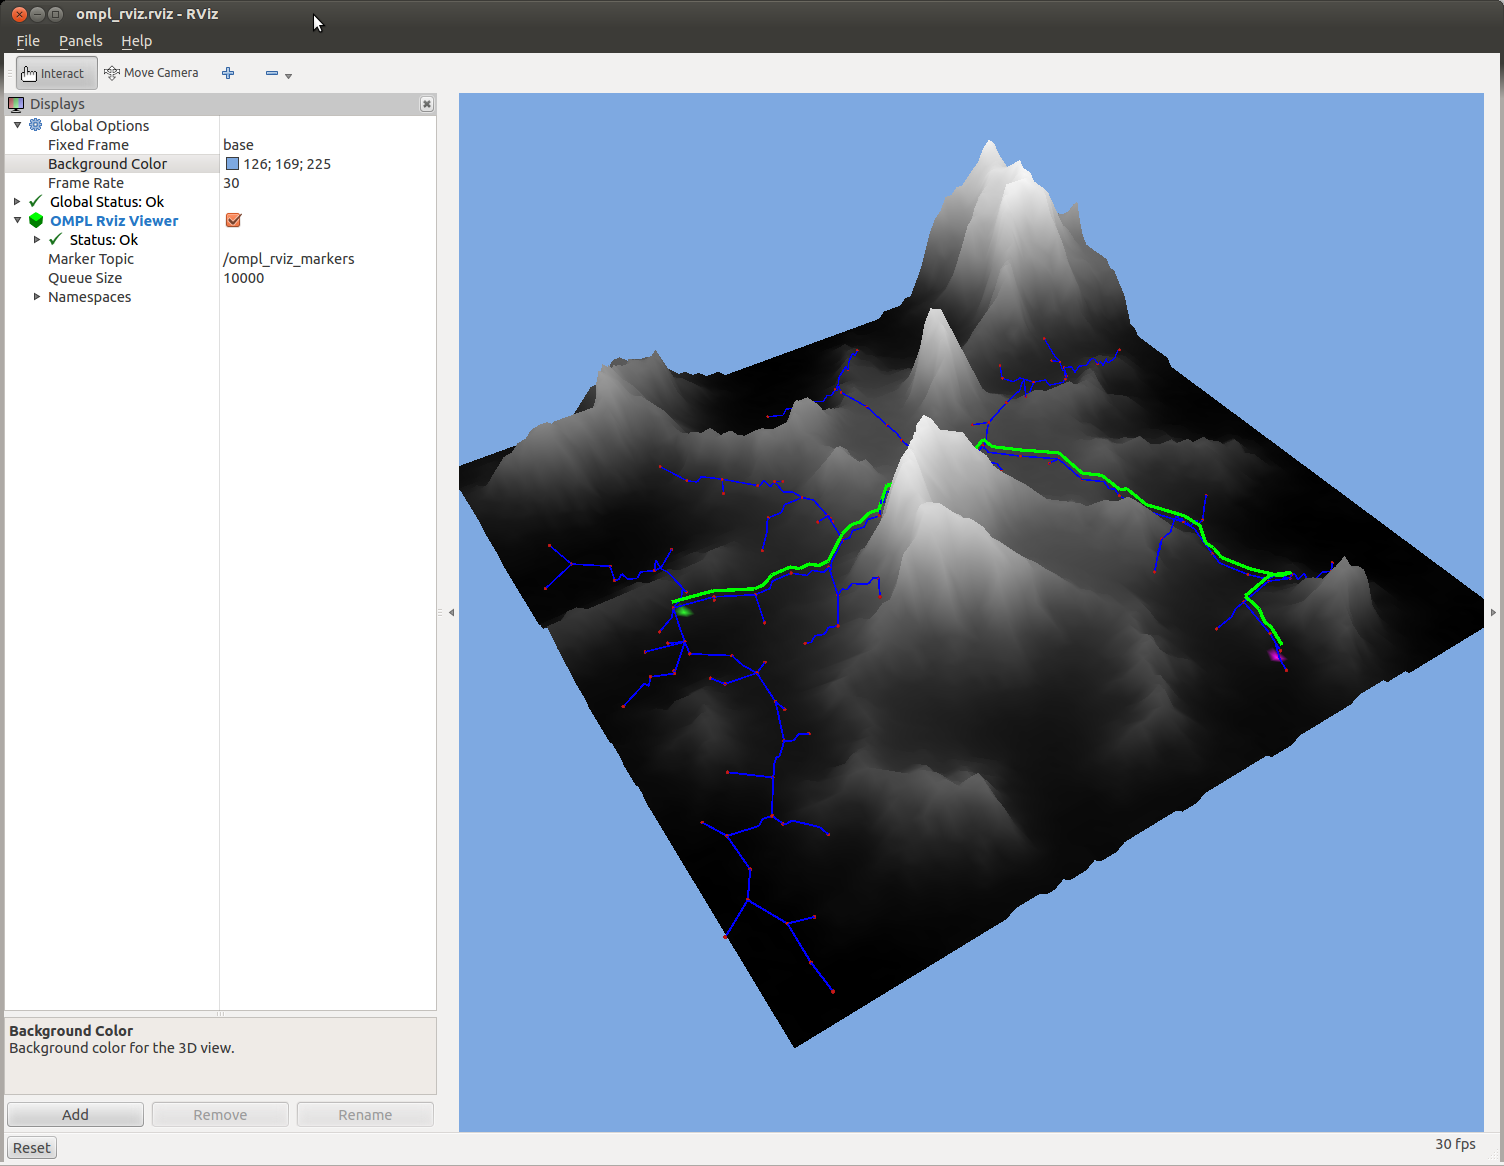
The OMPL Visual Tools is a library for visualizing and debugging Open Motion Planning Library algorithms in Rviz.
Formally named ompl_rviz_viewer until August 2014, this project spun out of an internship at Willow Garage. Video
The ompl_visual_tools was originally develped for testing cost-based algorithms in a two dimensional space with a third dimension displayed as cost. The space is specified as a grey scale cost map image that can be passed in to the program. The lighter (closer to white) each pixel of the image is, the “higher the cost” is considered to be. Black is considered no cost. Additionally, absolute obstacles can be specified by defining a max limit to the cost, such that any value above that threshold is considered an obstacle.
This little program is similar to the OMPL.app that is distributed with OMPL, but instead uses RViz for visualization and is more streamlined for considering costs and experience-based planning.
Developed by Dave Coleman at the University of Colorado Boulder and Willow Garage
Status:
-
 Travis CI
 -
Devel Job Status
-
AMD64 Debian Job Status
Install
Ubuntu Debian
sudo apt-get install ros-indigo-ompl-visual-tools
Build from Source
To build this package, git clone this repo into a catkin workspace and be sure to install necessary dependencies by running the following command in the root of your catkin workspace:
rosdep install -y --from-paths src --ignore-src --rosdistro indigo
Code API
See Class Reference
Usage
This library can be integrated into your project to easily view a 2D, 3D or robot planning environment in Rviz.
First, load the visualizer:
    // The visual tools for interfacing with Rviz
    ompl_visual_tools::OmplVisualToolsPtr visual_tools_;

    // Load the tool for displaying in Rviz
    visual_tools_.reset(new ompl_visual_tools::OmplVisualTools(BASE_FRAME));
    visual_tools_->setSpaceInformation(si_);
    visual_tools_->setGlobalScale(100);

    // Clear current rviz makers
    visual_tools_->deleteAllMarkers();
Two Dimensions with optional cost map
To test with a 2D environment with a cost map:
    // Cost in 2D
    ompl::base::CostMap2DOptimizationObjectivePtr cost_map_;
    cost_map_->max_cost_threshold_percent_ = max_cost_threshold_percent;
    cost_map_->loadImage(image_path);

    // Pass cost to visualizer
    visual_tools_->setCostMap(cost_map_->cost_);
To view the cost map in Rviz:
visual_tools_->publishCostMap(cost_map_->image_);
To view the start and goal location:
    visual_tools_->publishState(start, rviz_visual_tools::GREEN,  rviz_visual_tools::XLARGE, "plan_start_goal");
    visual_tools_->publishState(goal,  rviz_visual_tools::ORANGE, rviz_visual_tools::XLARGE, "plan_start_goal");
To view the solution path:
      // Interpolate solution
      simple_setup_->getSolutionPath().interpolate();

      // Show path
      visual_tools_->publishPath( simple_setup_->getSolutionPath(), rviz_visual_tools::GREEN, 1.0, "final_solution");
And to see more of what the planner was doing:
      // Visualize the explored space
      visual_tools_->publishGraph(planner_data, rviz_visual_tools::ORANGE, 0.2, "tree");

      // Visualize the sample locations
      visual_tools_->publishSamples(planner_data);
File truncated at 100 lines see the full file
CONTRIBUTING
Repository Summary
| Checkout URI | https://github.com/davetcoleman/ompl_visual_tools.git |
| VCS Type | git |
| VCS Version | indigo-devel |
| Last Updated | 2017-03-04 |
| Dev Status | DEVELOPED |
| Released | RELEASED |
| Tags | No category tags. |
| Contributing |
Help Wanted (0)
Good First Issues (0) Pull Requests to Review (0) |
Packages
| Name | Version |
|---|---|
| ompl_visual_tools | 2.3.2 |
README
OMPL Visual Tools
The OMPL Visual Tools is a library for visualizing and debugging Open Motion Planning Library algorithms in Rviz.
Formally named ompl_rviz_viewer until August 2014, this project spun out of an internship at Willow Garage. Video
The ompl_visual_tools was originally develped for testing cost-based algorithms in a two dimensional space with a third dimension displayed as cost. The space is specified as a grey scale cost map image that can be passed in to the program. The lighter (closer to white) each pixel of the image is, the “higher the cost” is considered to be. Black is considered no cost. Additionally, absolute obstacles can be specified by defining a max limit to the cost, such that any value above that threshold is considered an obstacle.
This little program is similar to the OMPL.app that is distributed with OMPL, but instead uses RViz for visualization and is more streamlined for considering costs and experience-based planning.
Developed by Dave Coleman at the University of Colorado Boulder and Willow Garage
Status:
-
Travis CI
-
-

How to Build
sudo apt-get install ros-indigo-ompl-visual-tools
Usage
This library can be integrated into your project to easily view a 2D, 3D or robot planning environment in Rviz.
First, load the visualizer:
    // The visual tools for interfacing with Rviz
    ompl_visual_tools::OmplVisualToolsPtr visual_tools_;

    // Load the tool for displaying in Rviz
    visual_tools_.reset(new ompl_visual_tools::OmplVisualTools(BASE_FRAME));
    visual_tools_->setSpaceInformation(si_);
    visual_tools_->setGlobalScale(100);

    // Clear current rviz makers
    visual_tools_->deleteAllMarkers();
Two Dimensions with optional cost map
To test with a 2D environment with a cost map:
    // Cost in 2D
    ompl::base::CostMap2DOptimizationObjectivePtr cost_map_;
    cost_map_->max_cost_threshold_percent_ = max_cost_threshold_percent;
    cost_map_->loadImage(image_path);

    // Pass cost to visualizer
    visual_tools_->setCostMap(cost_map_->cost_);
To view the cost map in Rviz:
visual_tools_->publishCostMap(cost_map_->image_);
To view the start and goal location:
    visual_tools_->publishState(start, rviz_visual_tools::GREEN,  rviz_visual_tools::XLARGE, "plan_start_goal");
    visual_tools_->publishState(goal,  rviz_visual_tools::ORANGE, rviz_visual_tools::XLARGE, "plan_start_goal");
To view the solution path:
      // Interpolate solution
      simple_setup_->getSolutionPath().interpolate();

      // Show path
      visual_tools_->publishPath( simple_setup_->getSolutionPath(), rviz_visual_tools::GREEN, 1.0, "final_solution");
And to see more of what the planner was doing:
      // Visualize the explored space
      visual_tools_->publishGraph(planner_data, rviz_visual_tools::ORANGE, 0.2, "tree");

      // Visualize the sample locations
      visual_tools_->publishSamples(planner_data);
MoveIt! Robot Planning
See moveit_visual_tools for more information about tools this class can use with MoveIt!. For OMPL-specific features:
First, set the state space that MoveIt! has chosen for your robot in OMPL:
``` // Create a state space describing our robot’s planning group ompl_interface::ModelBasedStateSpaceSpecification model_ss_spec(moveit_robot_model, joint_model_group);
File truncated at 100 lines see the full file